Immigrants from Nepal vs Luxembourger In Labor Force | Age 20-24
COMPARE
Immigrants from Nepal
Luxembourger
In Labor Force | Age 20-24
In Labor Force | Age 20-24 Comparison
Immigrants from Nepal
Luxembourgers
76.0%
IN LABOR FORCE | AGE 20-24
97.2/ 100
METRIC RATING
105th/ 347
METRIC RANK
79.0%
IN LABOR FORCE | AGE 20-24
100.0/ 100
METRIC RATING
7th/ 347
METRIC RANK
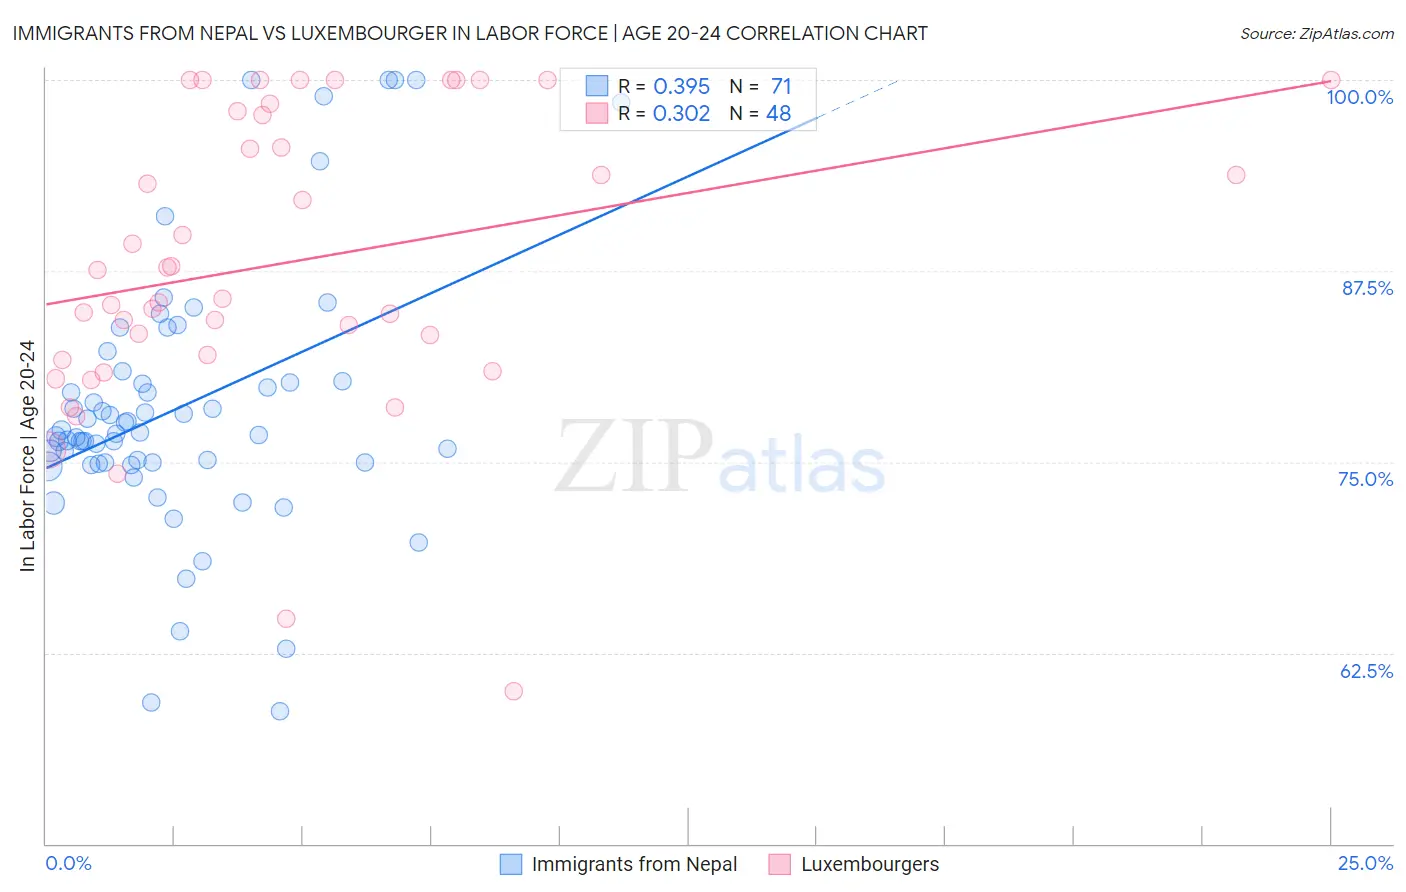
Immigrants from Nepal vs Luxembourger In Labor Force | Age 20-24 Correlation Chart
The statistical analysis conducted on geographies consisting of 186,788,747 people shows a mild positive correlation between the proportion of Immigrants from Nepal and labor force participation rate among population between the ages 20 and 24 in the United States with a correlation coefficient (R) of 0.395 and weighted average of 76.0%. Similarly, the statistical analysis conducted on geographies consisting of 144,663,767 people shows a mild positive correlation between the proportion of Luxembourgers and labor force participation rate among population between the ages 20 and 24 in the United States with a correlation coefficient (R) of 0.302 and weighted average of 79.0%, a difference of 3.9%.
In Labor Force | Age 20-24 Correlation Summary
| Measurement | Immigrants from Nepal | Luxembourger |
| Minimum | 58.7% | 60.0% |
| Maximum | 100.0% | 100.0% |
| Range | 41.3% | 40.0% |
| Mean | 78.6% | 88.1% |
| Median | 76.8% | 86.6% |
| Interquartile 25% (IQ1) | 74.9% | 81.9% |
| Interquartile 75% (IQ3) | 80.3% | 97.8% |
| Interquartile Range (IQR) | 5.4% | 16.0% |
| Standard Deviation (Sample) | 8.7% | 9.6% |
| Standard Deviation (Population) | 8.7% | 9.5% |
Similar Demographics by In Labor Force | Age 20-24
Demographics Similar to Immigrants from Nepal by In Labor Force | Age 20-24
In terms of in labor force | age 20-24, the demographic groups most similar to Immigrants from Nepal are Macedonian (76.0%, a difference of 0.0%), Immigrants from Uganda (76.0%, a difference of 0.010%), Immigrants from North Macedonia (76.1%, a difference of 0.040%), Greek (76.0%, a difference of 0.040%), and Latvian (76.1%, a difference of 0.060%).
| Demographics | Rating | Rank | In Labor Force | Age 20-24 |
| Immigrants | Oceania | 98.0 /100 | #98 | Exceptional 76.1% |
| Americans | 97.8 /100 | #99 | Exceptional 76.1% |
| Shoshone | 97.8 /100 | #100 | Exceptional 76.1% |
| Immigrants | Poland | 97.7 /100 | #101 | Exceptional 76.1% |
| Latvians | 97.6 /100 | #102 | Exceptional 76.1% |
| Immigrants | North Macedonia | 97.5 /100 | #103 | Exceptional 76.1% |
| Macedonians | 97.2 /100 | #104 | Exceptional 76.0% |
| Immigrants | Nepal | 97.2 /100 | #105 | Exceptional 76.0% |
| Immigrants | Uganda | 97.1 /100 | #106 | Exceptional 76.0% |
| Greeks | 96.9 /100 | #107 | Exceptional 76.0% |
| Iraqis | 96.6 /100 | #108 | Exceptional 76.0% |
| Cherokee | 95.8 /100 | #109 | Exceptional 75.9% |
| Immigrants | Morocco | 95.8 /100 | #110 | Exceptional 75.9% |
| Ukrainians | 95.7 /100 | #111 | Exceptional 75.9% |
| Immigrants | Canada | 95.6 /100 | #112 | Exceptional 75.9% |
Demographics Similar to Luxembourgers by In Labor Force | Age 20-24
In terms of in labor force | age 20-24, the demographic groups most similar to Luxembourgers are Danish (79.0%, a difference of 0.040%), Aleut (79.0%, a difference of 0.050%), Immigrants from Cabo Verde (78.9%, a difference of 0.10%), Swedish (78.8%, a difference of 0.17%), and Alaskan Athabascan (79.1%, a difference of 0.19%).
| Demographics | Rating | Rank | In Labor Force | Age 20-24 |
| Norwegians | 100.0 /100 | #1 | Exceptional 80.1% |
| Immigrants | Somalia | 100.0 /100 | #2 | Exceptional 79.5% |
| Somalis | 100.0 /100 | #3 | Exceptional 79.3% |
| Alaskan Athabascans | 100.0 /100 | #4 | Exceptional 79.1% |
| Aleuts | 100.0 /100 | #5 | Exceptional 79.0% |
| Danes | 100.0 /100 | #6 | Exceptional 79.0% |
| Luxembourgers | 100.0 /100 | #7 | Exceptional 79.0% |
| Immigrants | Cabo Verde | 100.0 /100 | #8 | Exceptional 78.9% |
| Swedes | 100.0 /100 | #9 | Exceptional 78.8% |
| Slovenes | 100.0 /100 | #10 | Exceptional 78.7% |
| Finns | 100.0 /100 | #11 | Exceptional 78.7% |
| Germans | 100.0 /100 | #12 | Exceptional 78.6% |
| Scandinavians | 100.0 /100 | #13 | Exceptional 78.5% |
| Czechs | 100.0 /100 | #14 | Exceptional 78.5% |
| Sudanese | 100.0 /100 | #15 | Exceptional 78.4% |