Yup'ik vs Delaware In Labor Force | Age 25-29
COMPARE
Yup'ik
Delaware
In Labor Force | Age 25-29
In Labor Force | Age 25-29 Comparison
Yup'ik
Delaware
73.1%
IN LABOR FORCE | AGE 25-29
0.0/ 100
METRIC RATING
347th/ 347
METRIC RANK
83.7%
IN LABOR FORCE | AGE 25-29
0.2/ 100
METRIC RATING
257th/ 347
METRIC RANK
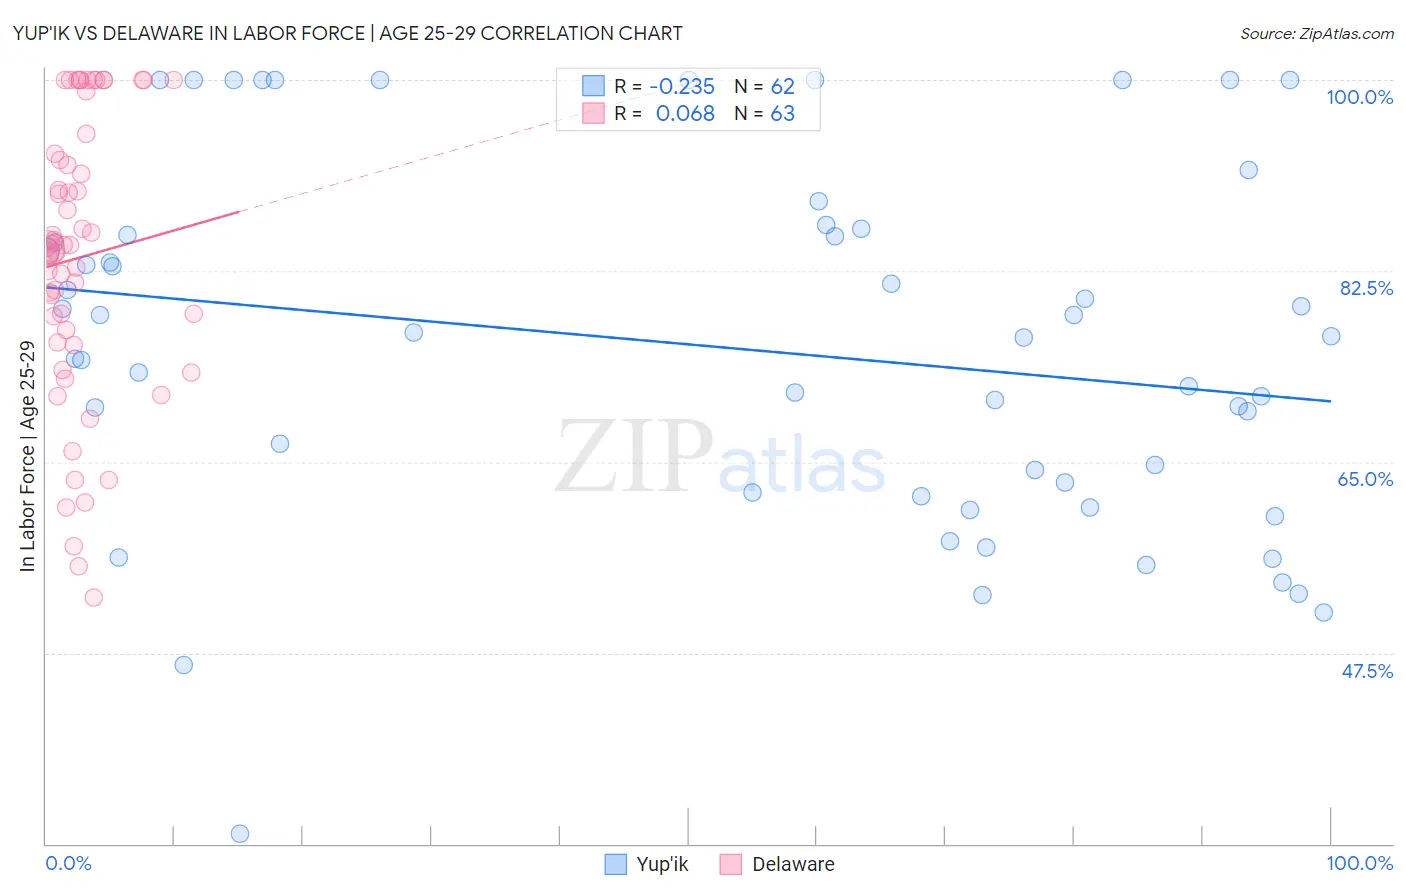
Yup'ik vs Delaware In Labor Force | Age 25-29 Correlation Chart
The statistical analysis conducted on geographies consisting of 39,957,575 people shows a weak negative correlation between the proportion of Yup'ik and labor force participation rate among population between the ages 25 and 29 in the United States with a correlation coefficient (R) of -0.235 and weighted average of 73.1%. Similarly, the statistical analysis conducted on geographies consisting of 96,226,507 people shows a slight positive correlation between the proportion of Delaware and labor force participation rate among population between the ages 25 and 29 in the United States with a correlation coefficient (R) of 0.068 and weighted average of 83.7%, a difference of 14.5%.
In Labor Force | Age 25-29 Correlation Summary
| Measurement | Yup'ik | Delaware |
| Minimum | 30.9% | 52.6% |
| Maximum | 100.0% | 100.0% |
| Range | 69.1% | 47.4% |
| Mean | 75.5% | 83.7% |
| Median | 76.4% | 84.7% |
| Interquartile 25% (IQ1) | 62.2% | 75.9% |
| Interquartile 75% (IQ3) | 85.8% | 93.3% |
| Interquartile Range (IQR) | 23.6% | 17.4% |
| Standard Deviation (Sample) | 16.4% | 12.8% |
| Standard Deviation (Population) | 16.3% | 12.7% |
Similar Demographics by In Labor Force | Age 25-29
Demographics Similar to Yup'ik by In Labor Force | Age 25-29
In terms of in labor force | age 25-29, the demographic groups most similar to Yup'ik are Pima (74.3%, a difference of 1.7%), Navajo (74.6%, a difference of 2.2%), Hopi (76.5%, a difference of 4.8%), Arapaho (76.6%, a difference of 4.8%), and Pueblo (77.5%, a difference of 6.1%).
| Demographics | Rating | Rank | In Labor Force | Age 25-29 |
| Sioux | 0.0 /100 | #333 | Tragic 79.7% |
| Yuman | 0.0 /100 | #334 | Tragic 79.3% |
| Natives/Alaskans | 0.0 /100 | #335 | Tragic 79.3% |
| Apache | 0.0 /100 | #336 | Tragic 79.2% |
| Crow | 0.0 /100 | #337 | Tragic 78.6% |
| Lumbee | 0.0 /100 | #338 | Tragic 78.3% |
| Immigrants | Yemen | 0.0 /100 | #339 | Tragic 78.2% |
| Paiute | 0.0 /100 | #340 | Tragic 78.1% |
| Tohono O'odham | 0.0 /100 | #341 | Tragic 77.5% |
| Pueblo | 0.0 /100 | #342 | Tragic 77.5% |
| Arapaho | 0.0 /100 | #343 | Tragic 76.6% |
| Hopi | 0.0 /100 | #344 | Tragic 76.5% |
| Navajo | 0.0 /100 | #345 | Tragic 74.6% |
| Pima | 0.0 /100 | #346 | Tragic 74.3% |
| Yup'ik | 0.0 /100 | #347 | Tragic 73.1% |
Demographics Similar to Delaware by In Labor Force | Age 25-29
In terms of in labor force | age 25-29, the demographic groups most similar to Delaware are Immigrants from Haiti (83.7%, a difference of 0.010%), Haitian (83.7%, a difference of 0.020%), Guatemalan (83.7%, a difference of 0.030%), Immigrants from Trinidad and Tobago (83.7%, a difference of 0.030%), and Spaniard (83.7%, a difference of 0.030%).
| Demographics | Rating | Rank | In Labor Force | Age 25-29 |
| Central Americans | 0.2 /100 | #250 | Tragic 83.7% |
| Bahamians | 0.2 /100 | #251 | Tragic 83.7% |
| Guatemalans | 0.2 /100 | #252 | Tragic 83.7% |
| Immigrants | Trinidad and Tobago | 0.2 /100 | #253 | Tragic 83.7% |
| Spaniards | 0.2 /100 | #254 | Tragic 83.7% |
| Haitians | 0.2 /100 | #255 | Tragic 83.7% |
| Immigrants | Haiti | 0.2 /100 | #256 | Tragic 83.7% |
| Delaware | 0.2 /100 | #257 | Tragic 83.7% |
| Immigrants | Guatemala | 0.1 /100 | #258 | Tragic 83.6% |
| Spanish | 0.1 /100 | #259 | Tragic 83.6% |
| Immigrants | Bahamas | 0.1 /100 | #260 | Tragic 83.6% |
| Pennsylvania Germans | 0.1 /100 | #261 | Tragic 83.6% |
| Immigrants | Fiji | 0.1 /100 | #262 | Tragic 83.6% |
| West Indians | 0.1 /100 | #263 | Tragic 83.5% |
| Puget Sound Salish | 0.1 /100 | #264 | Tragic 83.5% |