Immigrants from Peru vs Soviet Union In Labor Force | Age 45-54
COMPARE
Immigrants from Peru
Soviet Union
In Labor Force | Age 45-54
In Labor Force | Age 45-54 Comparison
Immigrants from Peru
Soviet Union
83.5%
IN LABOR FORCE | AGE 45-54
98.6/ 100
METRIC RATING
56th/ 347
METRIC RANK
83.0%
IN LABOR FORCE | AGE 45-54
76.8/ 100
METRIC RATING
144th/ 347
METRIC RANK
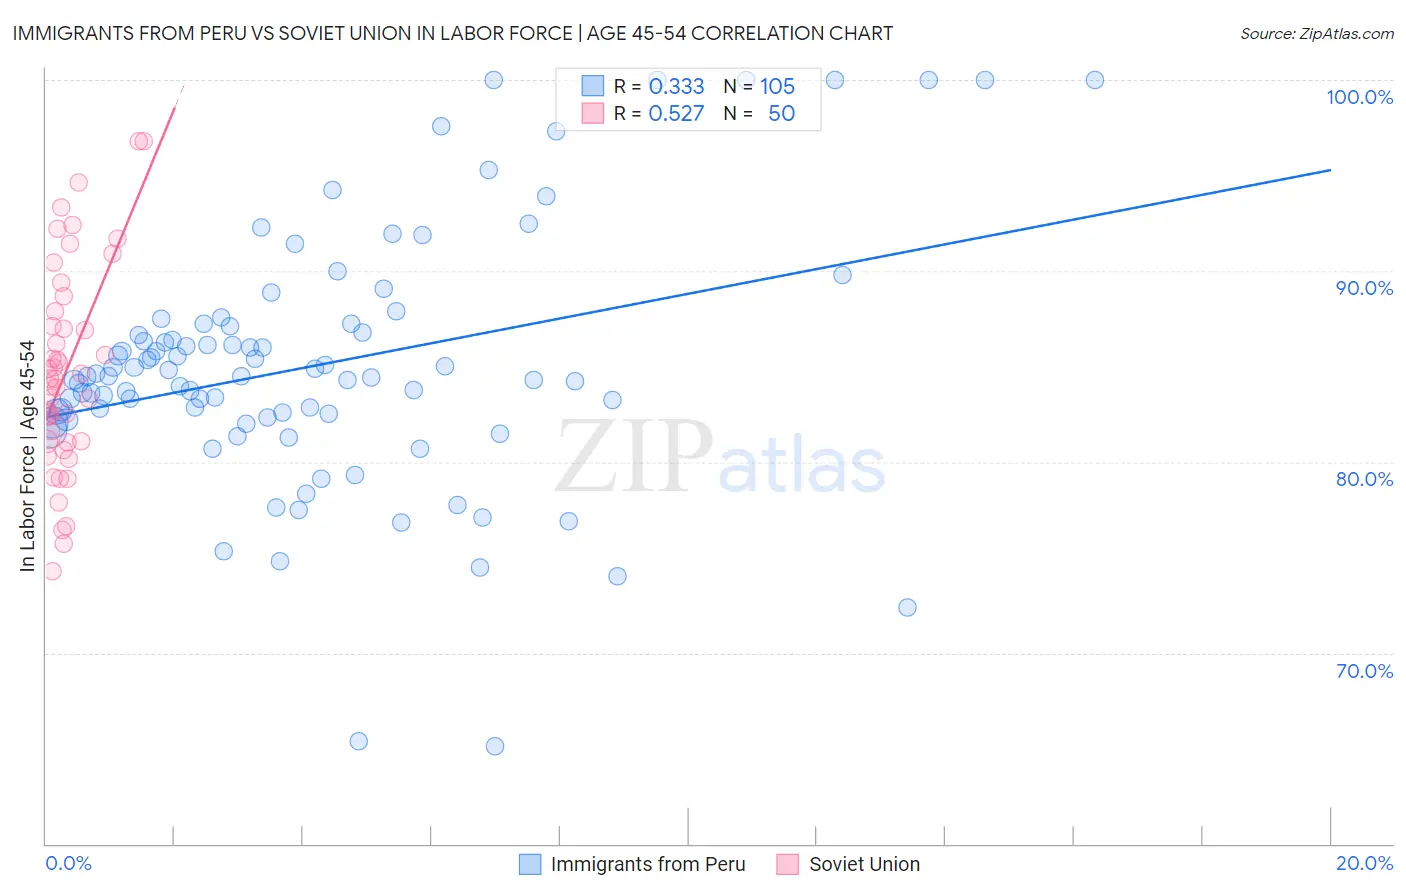
Immigrants from Peru vs Soviet Union In Labor Force | Age 45-54 Correlation Chart
The statistical analysis conducted on geographies consisting of 328,756,555 people shows a mild positive correlation between the proportion of Immigrants from Peru and labor force participation rate among population between the ages 45 and 54 in the United States with a correlation coefficient (R) of 0.333 and weighted average of 83.5%. Similarly, the statistical analysis conducted on geographies consisting of 43,509,630 people shows a substantial positive correlation between the proportion of Soviet Union and labor force participation rate among population between the ages 45 and 54 in the United States with a correlation coefficient (R) of 0.527 and weighted average of 83.0%, a difference of 0.66%.
In Labor Force | Age 45-54 Correlation Summary
| Measurement | Immigrants from Peru | Soviet Union |
| Minimum | 65.1% | 74.2% |
| Maximum | 100.0% | 96.8% |
| Range | 34.9% | 22.6% |
| Mean | 85.1% | 84.8% |
| Median | 84.5% | 84.4% |
| Interquartile 25% (IQ1) | 82.4% | 81.1% |
| Interquartile 75% (IQ3) | 87.2% | 87.9% |
| Interquartile Range (IQR) | 4.7% | 6.8% |
| Standard Deviation (Sample) | 6.6% | 5.4% |
| Standard Deviation (Population) | 6.6% | 5.3% |
Similar Demographics by In Labor Force | Age 45-54
Demographics Similar to Immigrants from Peru by In Labor Force | Age 45-54
In terms of in labor force | age 45-54, the demographic groups most similar to Immigrants from Peru are Paraguayan (83.5%, a difference of 0.010%), Somali (83.5%, a difference of 0.020%), Macedonian (83.5%, a difference of 0.020%), Eastern European (83.5%, a difference of 0.020%), and Immigrants from Turkey (83.6%, a difference of 0.030%).
| Demographics | Rating | Rank | In Labor Force | Age 45-54 |
| Immigrants | Morocco | 99.0 /100 | #49 | Exceptional 83.6% |
| Immigrants | Greece | 98.8 /100 | #50 | Exceptional 83.6% |
| Immigrants | Turkey | 98.8 /100 | #51 | Exceptional 83.6% |
| Poles | 98.7 /100 | #52 | Exceptional 83.6% |
| Peruvians | 98.7 /100 | #53 | Exceptional 83.6% |
| Somalis | 98.7 /100 | #54 | Exceptional 83.5% |
| Macedonians | 98.7 /100 | #55 | Exceptional 83.5% |
| Immigrants | Peru | 98.6 /100 | #56 | Exceptional 83.5% |
| Paraguayans | 98.5 /100 | #57 | Exceptional 83.5% |
| Eastern Europeans | 98.5 /100 | #58 | Exceptional 83.5% |
| Bhutanese | 98.3 /100 | #59 | Exceptional 83.5% |
| Carpatho Rusyns | 98.3 /100 | #60 | Exceptional 83.5% |
| Filipinos | 98.3 /100 | #61 | Exceptional 83.5% |
| Immigrants | Taiwan | 98.0 /100 | #62 | Exceptional 83.5% |
| Afghans | 97.9 /100 | #63 | Exceptional 83.5% |
Demographics Similar to Soviet Union by In Labor Force | Age 45-54
In terms of in labor force | age 45-54, the demographic groups most similar to Soviet Union are Okinawan (83.0%, a difference of 0.0%), Immigrants from Haiti (83.0%, a difference of 0.010%), Immigrants from Scotland (83.0%, a difference of 0.010%), Scandinavian (83.0%, a difference of 0.020%), and Yugoslavian (83.0%, a difference of 0.020%).
| Demographics | Rating | Rank | In Labor Force | Age 45-54 |
| Immigrants | Spain | 80.4 /100 | #137 | Excellent 83.0% |
| Ghanaians | 79.5 /100 | #138 | Good 83.0% |
| Scandinavians | 78.5 /100 | #139 | Good 83.0% |
| Yugoslavians | 78.3 /100 | #140 | Good 83.0% |
| Immigrants | Haiti | 77.9 /100 | #141 | Good 83.0% |
| Immigrants | Scotland | 77.8 /100 | #142 | Good 83.0% |
| Okinawans | 77.0 /100 | #143 | Good 83.0% |
| Soviet Union | 76.8 /100 | #144 | Good 83.0% |
| Romanians | 75.4 /100 | #145 | Good 83.0% |
| Immigrants | France | 75.3 /100 | #146 | Good 83.0% |
| Czechoslovakians | 74.8 /100 | #147 | Good 83.0% |
| Immigrants | Nigeria | 74.1 /100 | #148 | Good 83.0% |
| Immigrants | Sweden | 73.3 /100 | #149 | Good 82.9% |
| Immigrants | Netherlands | 72.6 /100 | #150 | Good 82.9% |
| Koreans | 71.9 /100 | #151 | Good 82.9% |