Immigrants from Liberia vs Hispanic or Latino In Labor Force | Age 20-64
COMPARE
Immigrants from Liberia
Hispanic or Latino
In Labor Force | Age 20-64
In Labor Force | Age 20-64 Comparison
Immigrants from Liberia
Hispanics or Latinos
80.5%
IN LABOR FORCE | AGE 20-64
99.8/ 100
METRIC RATING
41st/ 347
METRIC RANK
77.6%
IN LABOR FORCE | AGE 20-64
0.0/ 100
METRIC RATING
299th/ 347
METRIC RANK
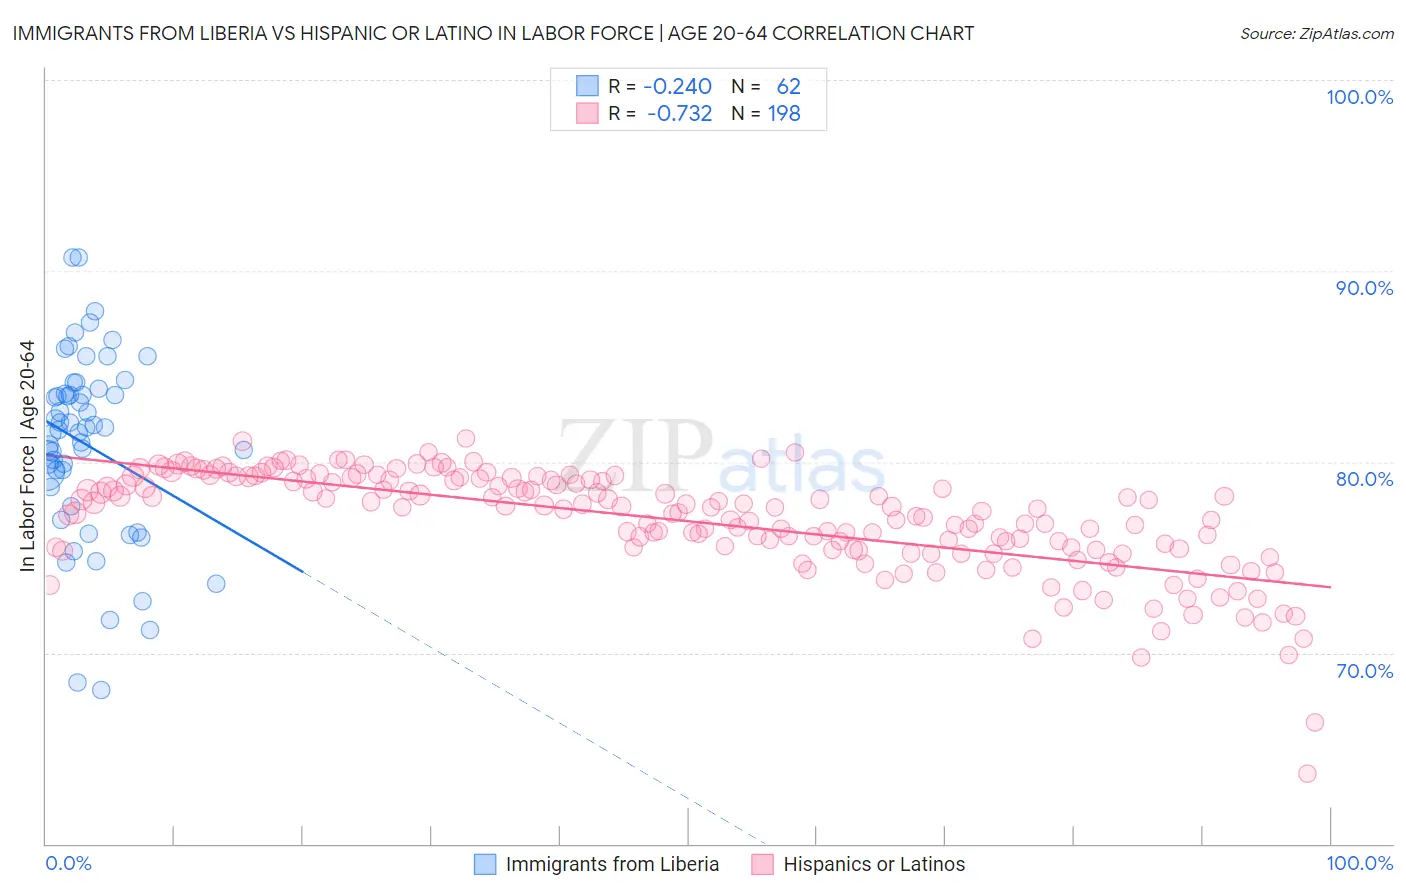
Immigrants from Liberia vs Hispanic or Latino In Labor Force | Age 20-64 Correlation Chart
The statistical analysis conducted on geographies consisting of 135,283,849 people shows a weak negative correlation between the proportion of Immigrants from Liberia and labor force participation rate among population between the ages 20 and 64 in the United States with a correlation coefficient (R) of -0.240 and weighted average of 80.5%. Similarly, the statistical analysis conducted on geographies consisting of 575,448,606 people shows a strong negative correlation between the proportion of Hispanics or Latinos and labor force participation rate among population between the ages 20 and 64 in the United States with a correlation coefficient (R) of -0.732 and weighted average of 77.6%, a difference of 3.8%.
In Labor Force | Age 20-64 Correlation Summary
| Measurement | Immigrants from Liberia | Hispanic or Latino |
| Minimum | 68.1% | 63.7% |
| Maximum | 90.7% | 81.2% |
| Range | 22.6% | 17.6% |
| Mean | 80.9% | 76.9% |
| Median | 81.7% | 77.6% |
| Interquartile 25% (IQ1) | 78.7% | 75.4% |
| Interquartile 75% (IQ3) | 83.6% | 79.1% |
| Interquartile Range (IQR) | 4.9% | 3.7% |
| Standard Deviation (Sample) | 4.8% | 2.7% |
| Standard Deviation (Population) | 4.8% | 2.7% |
Similar Demographics by In Labor Force | Age 20-64
Demographics Similar to Immigrants from Liberia by In Labor Force | Age 20-64
In terms of in labor force | age 20-64, the demographic groups most similar to Immigrants from Liberia are Immigrants from Zimbabwe (80.5%, a difference of 0.010%), Ugandan (80.6%, a difference of 0.020%), Brazilian (80.5%, a difference of 0.020%), Latvian (80.5%, a difference of 0.020%), and Czech (80.5%, a difference of 0.030%).
| Demographics | Rating | Rank | In Labor Force | Age 20-64 |
| Immigrants | Brazil | 99.9 /100 | #34 | Exceptional 80.7% |
| Immigrants | Poland | 99.9 /100 | #35 | Exceptional 80.6% |
| Paraguayans | 99.8 /100 | #36 | Exceptional 80.6% |
| Immigrants | Moldova | 99.8 /100 | #37 | Exceptional 80.6% |
| Ugandans | 99.8 /100 | #38 | Exceptional 80.6% |
| Brazilians | 99.8 /100 | #39 | Exceptional 80.5% |
| Immigrants | Zimbabwe | 99.8 /100 | #40 | Exceptional 80.5% |
| Immigrants | Liberia | 99.8 /100 | #41 | Exceptional 80.5% |
| Latvians | 99.8 /100 | #42 | Exceptional 80.5% |
| Czechs | 99.7 /100 | #43 | Exceptional 80.5% |
| Immigrants | Middle Africa | 99.7 /100 | #44 | Exceptional 80.5% |
| Slovenes | 99.7 /100 | #45 | Exceptional 80.5% |
| Immigrants | Pakistan | 99.6 /100 | #46 | Exceptional 80.5% |
| Immigrants | Africa | 99.6 /100 | #47 | Exceptional 80.4% |
| Immigrants | Hong Kong | 99.5 /100 | #48 | Exceptional 80.4% |
Demographics Similar to Hispanics or Latinos by In Labor Force | Age 20-64
In terms of in labor force | age 20-64, the demographic groups most similar to Hispanics or Latinos are Cree (77.7%, a difference of 0.060%), Immigrants from Dominican Republic (77.7%, a difference of 0.070%), Dominican (77.7%, a difference of 0.070%), Spanish American Indian (77.6%, a difference of 0.070%), and Immigrants from Grenada (77.7%, a difference of 0.11%).
| Demographics | Rating | Rank | In Labor Force | Age 20-64 |
| Immigrants | Azores | 0.0 /100 | #292 | Tragic 77.8% |
| Delaware | 0.0 /100 | #293 | Tragic 77.8% |
| Immigrants | Central America | 0.0 /100 | #294 | Tragic 77.7% |
| Immigrants | Grenada | 0.0 /100 | #295 | Tragic 77.7% |
| Immigrants | Dominican Republic | 0.0 /100 | #296 | Tragic 77.7% |
| Dominicans | 0.0 /100 | #297 | Tragic 77.7% |
| Cree | 0.0 /100 | #298 | Tragic 77.7% |
| Hispanics or Latinos | 0.0 /100 | #299 | Tragic 77.6% |
| Spanish American Indians | 0.0 /100 | #300 | Tragic 77.6% |
| Nepalese | 0.0 /100 | #301 | Tragic 77.5% |
| Iroquois | 0.0 /100 | #302 | Tragic 77.5% |
| Chippewa | 0.0 /100 | #303 | Tragic 77.3% |
| Immigrants | Mexico | 0.0 /100 | #304 | Tragic 77.3% |
| Mexicans | 0.0 /100 | #305 | Tragic 77.2% |
| Potawatomi | 0.0 /100 | #306 | Tragic 77.2% |