Immigrants from Liberia vs Immigrants from Argentina In Labor Force | Age 20-64
COMPARE
Immigrants from Liberia
Immigrants from Argentina
In Labor Force | Age 20-64
In Labor Force | Age 20-64 Comparison
Immigrants from Liberia
Immigrants from Argentina
80.5%
IN LABOR FORCE | AGE 20-64
99.8/ 100
METRIC RATING
41st/ 347
METRIC RANK
80.0%
IN LABOR FORCE | AGE 20-64
94.1/ 100
METRIC RATING
109th/ 347
METRIC RANK
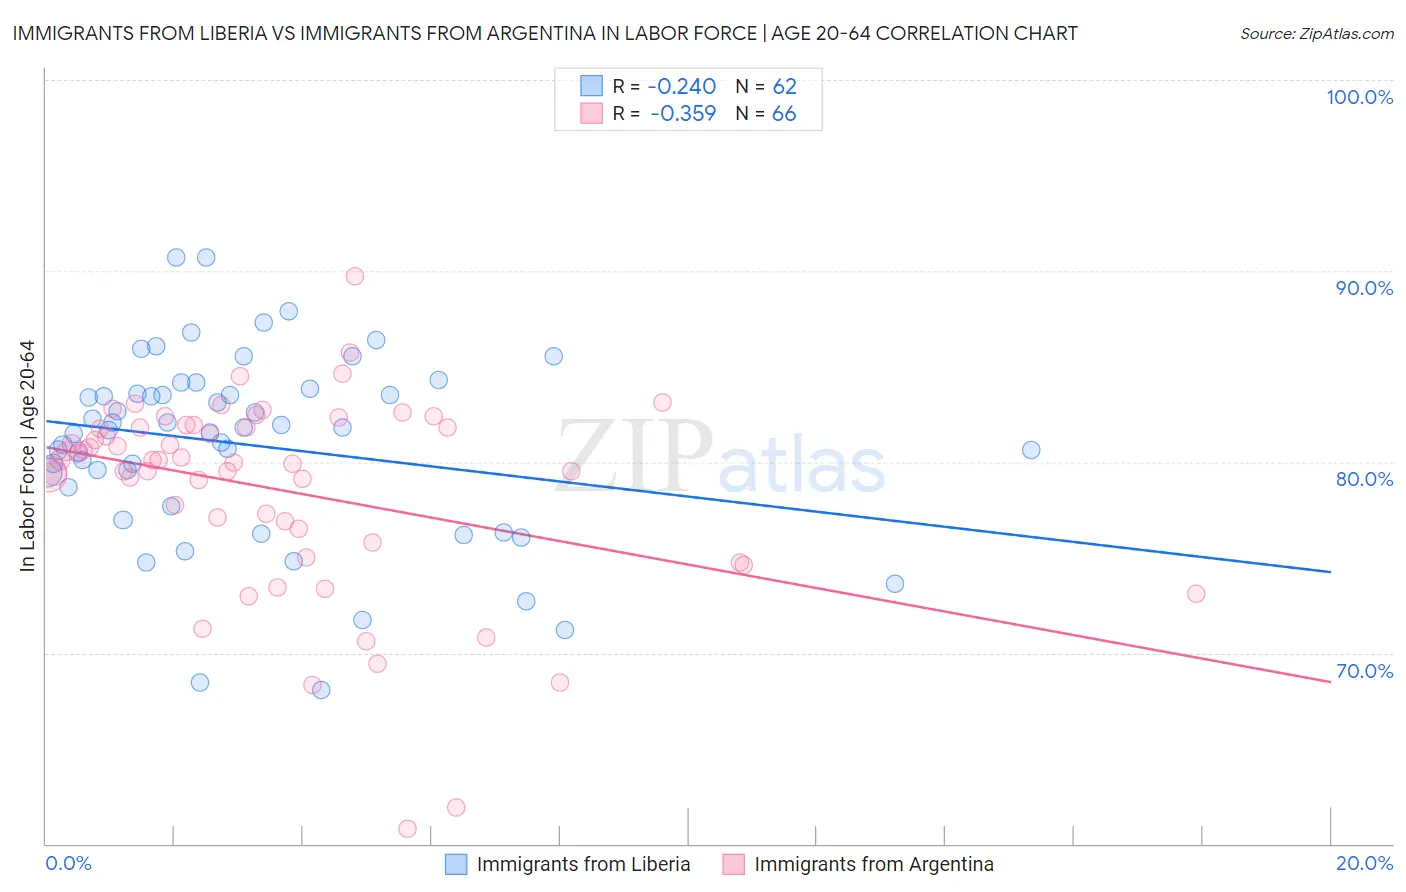
Immigrants from Liberia vs Immigrants from Argentina In Labor Force | Age 20-64 Correlation Chart
The statistical analysis conducted on geographies consisting of 135,283,849 people shows a weak negative correlation between the proportion of Immigrants from Liberia and labor force participation rate among population between the ages 20 and 64 in the United States with a correlation coefficient (R) of -0.240 and weighted average of 80.5%. Similarly, the statistical analysis conducted on geographies consisting of 264,436,080 people shows a mild negative correlation between the proportion of Immigrants from Argentina and labor force participation rate among population between the ages 20 and 64 in the United States with a correlation coefficient (R) of -0.359 and weighted average of 80.0%, a difference of 0.67%.
In Labor Force | Age 20-64 Correlation Summary
| Measurement | Immigrants from Liberia | Immigrants from Argentina |
| Minimum | 68.1% | 60.8% |
| Maximum | 90.7% | 89.7% |
| Range | 22.6% | 28.9% |
| Mean | 80.9% | 78.6% |
| Median | 81.7% | 80.1% |
| Interquartile 25% (IQ1) | 78.7% | 76.5% |
| Interquartile 75% (IQ3) | 83.6% | 81.8% |
| Interquartile Range (IQR) | 4.9% | 5.3% |
| Standard Deviation (Sample) | 4.8% | 5.3% |
| Standard Deviation (Population) | 4.8% | 5.2% |
Similar Demographics by In Labor Force | Age 20-64
Demographics Similar to Immigrants from Liberia by In Labor Force | Age 20-64
In terms of in labor force | age 20-64, the demographic groups most similar to Immigrants from Liberia are Immigrants from Zimbabwe (80.5%, a difference of 0.010%), Ugandan (80.6%, a difference of 0.020%), Brazilian (80.5%, a difference of 0.020%), Latvian (80.5%, a difference of 0.020%), and Czech (80.5%, a difference of 0.030%).
| Demographics | Rating | Rank | In Labor Force | Age 20-64 |
| Immigrants | Brazil | 99.9 /100 | #34 | Exceptional 80.7% |
| Immigrants | Poland | 99.9 /100 | #35 | Exceptional 80.6% |
| Paraguayans | 99.8 /100 | #36 | Exceptional 80.6% |
| Immigrants | Moldova | 99.8 /100 | #37 | Exceptional 80.6% |
| Ugandans | 99.8 /100 | #38 | Exceptional 80.6% |
| Brazilians | 99.8 /100 | #39 | Exceptional 80.5% |
| Immigrants | Zimbabwe | 99.8 /100 | #40 | Exceptional 80.5% |
| Immigrants | Liberia | 99.8 /100 | #41 | Exceptional 80.5% |
| Latvians | 99.8 /100 | #42 | Exceptional 80.5% |
| Czechs | 99.7 /100 | #43 | Exceptional 80.5% |
| Immigrants | Middle Africa | 99.7 /100 | #44 | Exceptional 80.5% |
| Slovenes | 99.7 /100 | #45 | Exceptional 80.5% |
| Immigrants | Pakistan | 99.6 /100 | #46 | Exceptional 80.5% |
| Immigrants | Africa | 99.6 /100 | #47 | Exceptional 80.4% |
| Immigrants | Hong Kong | 99.5 /100 | #48 | Exceptional 80.4% |
Demographics Similar to Immigrants from Argentina by In Labor Force | Age 20-64
In terms of in labor force | age 20-64, the demographic groups most similar to Immigrants from Argentina are Estonian (80.0%, a difference of 0.0%), Iranian (80.0%, a difference of 0.010%), Immigrants from South America (80.0%, a difference of 0.010%), Immigrants from Italy (80.0%, a difference of 0.010%), and Sri Lankan (80.0%, a difference of 0.010%).
| Demographics | Rating | Rank | In Labor Force | Age 20-64 |
| Immigrants | Australia | 95.5 /100 | #102 | Exceptional 80.0% |
| Russians | 95.5 /100 | #103 | Exceptional 80.0% |
| Venezuelans | 95.3 /100 | #104 | Exceptional 80.0% |
| Immigrants | Ghana | 95.0 /100 | #105 | Exceptional 80.0% |
| Greeks | 94.8 /100 | #106 | Exceptional 80.0% |
| Immigrants | Jordan | 94.8 /100 | #107 | Exceptional 80.0% |
| Iranians | 94.3 /100 | #108 | Exceptional 80.0% |
| Immigrants | Argentina | 94.1 /100 | #109 | Exceptional 80.0% |
| Estonians | 94.0 /100 | #110 | Exceptional 80.0% |
| Immigrants | South America | 93.9 /100 | #111 | Exceptional 80.0% |
| Immigrants | Italy | 93.9 /100 | #112 | Exceptional 80.0% |
| Sri Lankans | 93.9 /100 | #113 | Exceptional 80.0% |
| Argentineans | 93.8 /100 | #114 | Exceptional 80.0% |
| Bermudans | 93.3 /100 | #115 | Exceptional 80.0% |
| Immigrants | Western Africa | 93.1 /100 | #116 | Exceptional 80.0% |