Immigrants from Iran vs Immigrants from Jordan In Labor Force | Age 20-64
COMPARE
Immigrants from Iran
Immigrants from Jordan
In Labor Force | Age 20-64
In Labor Force | Age 20-64 Comparison
Immigrants from Iran
Immigrants from Jordan
79.9%
IN LABOR FORCE | AGE 20-64
88.3/ 100
METRIC RATING
131st/ 347
METRIC RANK
80.0%
IN LABOR FORCE | AGE 20-64
94.8/ 100
METRIC RATING
107th/ 347
METRIC RANK
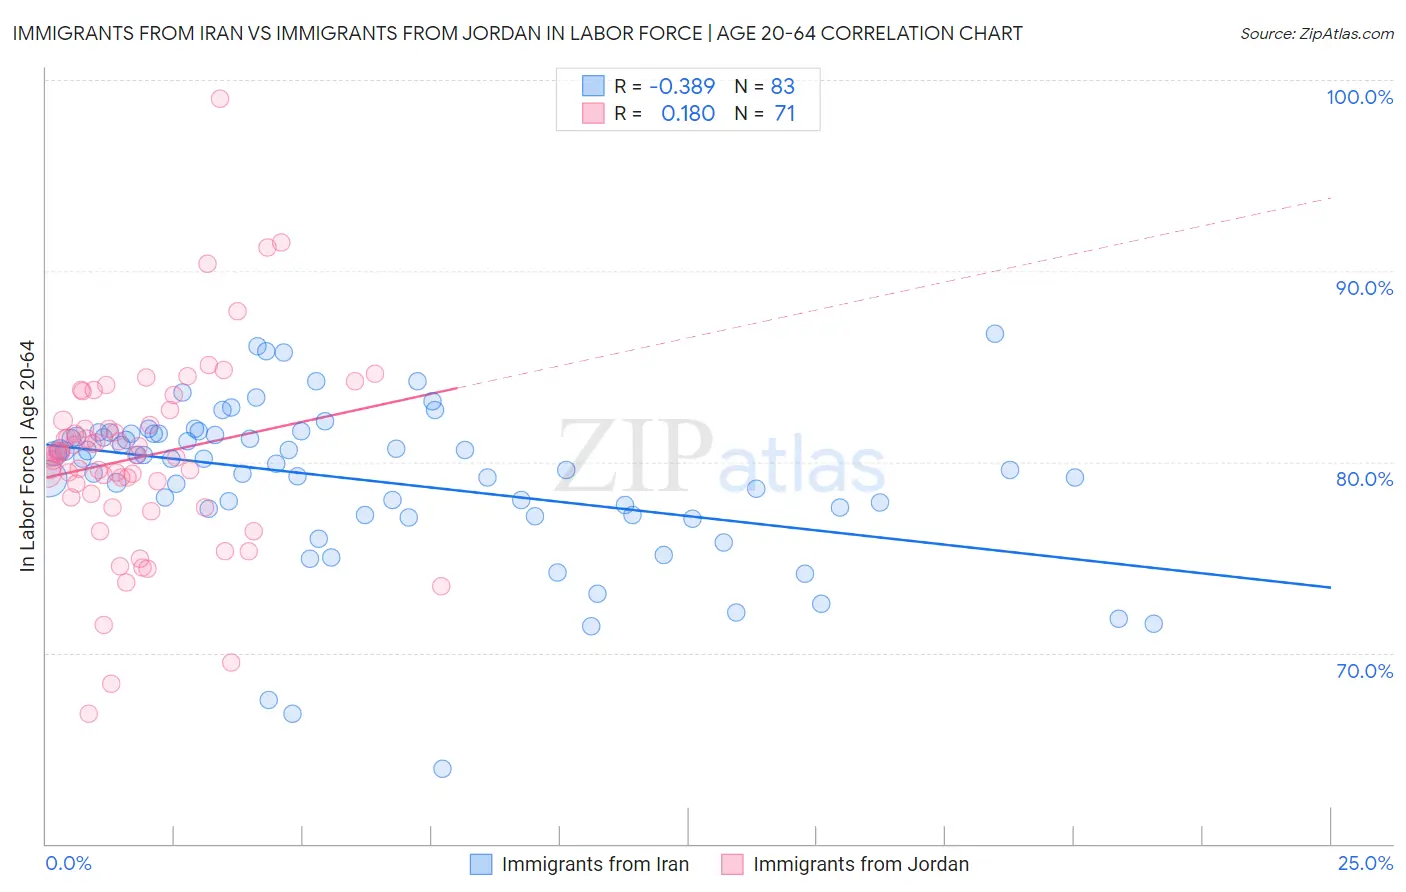
Immigrants from Iran vs Immigrants from Jordan In Labor Force | Age 20-64 Correlation Chart
The statistical analysis conducted on geographies consisting of 279,901,668 people shows a mild negative correlation between the proportion of Immigrants from Iran and labor force participation rate among population between the ages 20 and 64 in the United States with a correlation coefficient (R) of -0.389 and weighted average of 79.9%. Similarly, the statistical analysis conducted on geographies consisting of 181,282,289 people shows a poor positive correlation between the proportion of Immigrants from Jordan and labor force participation rate among population between the ages 20 and 64 in the United States with a correlation coefficient (R) of 0.180 and weighted average of 80.0%, a difference of 0.18%.
In Labor Force | Age 20-64 Correlation Summary
| Measurement | Immigrants from Iran | Immigrants from Jordan |
| Minimum | 63.9% | 66.8% |
| Maximum | 86.7% | 99.0% |
| Range | 22.8% | 32.2% |
| Mean | 79.0% | 80.2% |
| Median | 80.1% | 80.3% |
| Interquartile 25% (IQ1) | 77.3% | 78.2% |
| Interquartile 75% (IQ3) | 81.5% | 82.2% |
| Interquartile Range (IQR) | 4.2% | 4.0% |
| Standard Deviation (Sample) | 4.2% | 5.1% |
| Standard Deviation (Population) | 4.2% | 5.1% |
Similar Demographics by In Labor Force | Age 20-64
Demographics Similar to Immigrants from Iran by In Labor Force | Age 20-64
In terms of in labor force | age 20-64, the demographic groups most similar to Immigrants from Iran are Italian (79.9%, a difference of 0.010%), Immigrants from Zaire (79.9%, a difference of 0.010%), Indian (Asian) (79.9%, a difference of 0.010%), South American Indian (79.9%, a difference of 0.010%), and Immigrants from Eastern Asia (79.9%, a difference of 0.020%).
| Demographics | Rating | Rank | In Labor Force | Age 20-64 |
| Immigrants | Europe | 91.6 /100 | #124 | Exceptional 79.9% |
| Danes | 91.5 /100 | #125 | Exceptional 79.9% |
| Immigrants | France | 90.7 /100 | #126 | Exceptional 79.9% |
| Immigrants | Czechoslovakia | 89.7 /100 | #127 | Excellent 79.9% |
| Immigrants | Eastern Asia | 89.4 /100 | #128 | Excellent 79.9% |
| Italians | 88.9 /100 | #129 | Excellent 79.9% |
| Immigrants | Zaire | 88.6 /100 | #130 | Excellent 79.9% |
| Immigrants | Iran | 88.3 /100 | #131 | Excellent 79.9% |
| Indians (Asian) | 87.7 /100 | #132 | Excellent 79.9% |
| South American Indians | 87.6 /100 | #133 | Excellent 79.9% |
| Belgians | 87.4 /100 | #134 | Excellent 79.9% |
| Ukrainians | 86.8 /100 | #135 | Excellent 79.9% |
| Immigrants | Singapore | 86.7 /100 | #136 | Excellent 79.9% |
| Immigrants | Ukraine | 86.5 /100 | #137 | Excellent 79.9% |
| Immigrants | Nigeria | 86.4 /100 | #138 | Excellent 79.9% |
Demographics Similar to Immigrants from Jordan by In Labor Force | Age 20-64
In terms of in labor force | age 20-64, the demographic groups most similar to Immigrants from Jordan are Greek (80.0%, a difference of 0.0%), Immigrants from Ghana (80.0%, a difference of 0.010%), Venezuelan (80.0%, a difference of 0.020%), Iranian (80.0%, a difference of 0.020%), and Filipino (80.1%, a difference of 0.030%).
| Demographics | Rating | Rank | In Labor Force | Age 20-64 |
| Filipinos | 95.6 /100 | #100 | Exceptional 80.1% |
| Palestinians | 95.5 /100 | #101 | Exceptional 80.0% |
| Immigrants | Australia | 95.5 /100 | #102 | Exceptional 80.0% |
| Russians | 95.5 /100 | #103 | Exceptional 80.0% |
| Venezuelans | 95.3 /100 | #104 | Exceptional 80.0% |
| Immigrants | Ghana | 95.0 /100 | #105 | Exceptional 80.0% |
| Greeks | 94.8 /100 | #106 | Exceptional 80.0% |
| Immigrants | Jordan | 94.8 /100 | #107 | Exceptional 80.0% |
| Iranians | 94.3 /100 | #108 | Exceptional 80.0% |
| Immigrants | Argentina | 94.1 /100 | #109 | Exceptional 80.0% |
| Estonians | 94.0 /100 | #110 | Exceptional 80.0% |
| Immigrants | South America | 93.9 /100 | #111 | Exceptional 80.0% |
| Immigrants | Italy | 93.9 /100 | #112 | Exceptional 80.0% |
| Sri Lankans | 93.9 /100 | #113 | Exceptional 80.0% |
| Argentineans | 93.8 /100 | #114 | Exceptional 80.0% |