Immigrants from Korea vs Tohono O'odham In Labor Force | Age > 16
COMPARE
Immigrants from Korea
Tohono O'odham
In Labor Force | Age > 16
In Labor Force | Age > 16 Comparison
Immigrants from Korea
Tohono O'odham
66.2%
IN LABOR FORCE | AGE > 16
99.7/ 100
METRIC RATING
74th/ 347
METRIC RANK
57.2%
IN LABOR FORCE | AGE > 16
0.0/ 100
METRIC RATING
345th/ 347
METRIC RANK
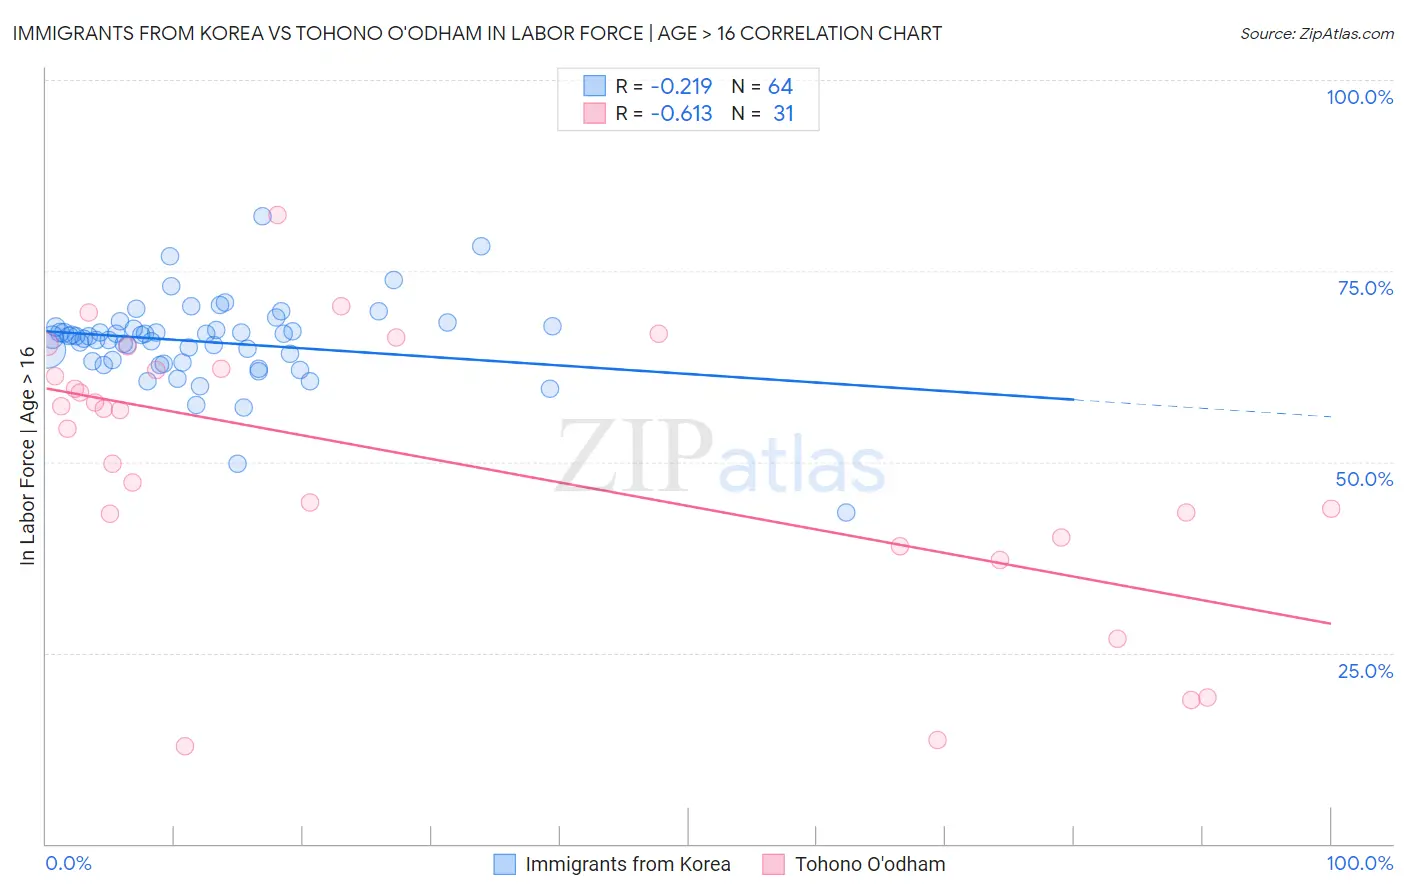
Immigrants from Korea vs Tohono O'odham In Labor Force | Age > 16 Correlation Chart
The statistical analysis conducted on geographies consisting of 416,355,366 people shows a weak negative correlation between the proportion of Immigrants from Korea and labor force participation rate among population ages 16 and over in the United States with a correlation coefficient (R) of -0.219 and weighted average of 66.2%. Similarly, the statistical analysis conducted on geographies consisting of 58,725,311 people shows a significant negative correlation between the proportion of Tohono O'odham and labor force participation rate among population ages 16 and over in the United States with a correlation coefficient (R) of -0.613 and weighted average of 57.2%, a difference of 15.6%.
In Labor Force | Age > 16 Correlation Summary
| Measurement | Immigrants from Korea | Tohono O'odham |
| Minimum | 43.4% | 12.8% |
| Maximum | 82.1% | 82.3% |
| Range | 38.7% | 69.5% |
| Mean | 65.7% | 50.1% |
| Median | 66.5% | 56.8% |
| Interquartile 25% (IQ1) | 63.1% | 40.1% |
| Interquartile 75% (IQ3) | 67.5% | 62.2% |
| Interquartile Range (IQR) | 4.5% | 22.1% |
| Standard Deviation (Sample) | 5.6% | 17.7% |
| Standard Deviation (Population) | 5.6% | 17.4% |
Similar Demographics by In Labor Force | Age > 16
Demographics Similar to Immigrants from Korea by In Labor Force | Age > 16
In terms of in labor force | age > 16, the demographic groups most similar to Immigrants from Korea are Immigrants from Vietnam (66.2%, a difference of 0.0%), Burmese (66.2%, a difference of 0.010%), Taiwanese (66.2%, a difference of 0.010%), Immigrants from Singapore (66.2%, a difference of 0.010%), and Asian (66.2%, a difference of 0.030%).
| Demographics | Rating | Rank | In Labor Force | Age > 16 |
| Egyptians | 99.8 /100 | #67 | Exceptional 66.2% |
| Immigrants | Egypt | 99.7 /100 | #68 | Exceptional 66.2% |
| Sub-Saharan Africans | 99.7 /100 | #69 | Exceptional 66.2% |
| Asians | 99.7 /100 | #70 | Exceptional 66.2% |
| Burmese | 99.7 /100 | #71 | Exceptional 66.2% |
| Taiwanese | 99.7 /100 | #72 | Exceptional 66.2% |
| Immigrants | Vietnam | 99.7 /100 | #73 | Exceptional 66.2% |
| Immigrants | Korea | 99.7 /100 | #74 | Exceptional 66.2% |
| Immigrants | Singapore | 99.7 /100 | #75 | Exceptional 66.2% |
| Immigrants | Malaysia | 99.6 /100 | #76 | Exceptional 66.1% |
| Immigrants | Moldova | 99.6 /100 | #77 | Exceptional 66.1% |
| Immigrants | Asia | 99.6 /100 | #78 | Exceptional 66.1% |
| Turks | 99.6 /100 | #79 | Exceptional 66.1% |
| Malaysians | 99.6 /100 | #80 | Exceptional 66.1% |
| Moroccans | 99.5 /100 | #81 | Exceptional 66.1% |
Demographics Similar to Tohono O'odham by In Labor Force | Age > 16
In terms of in labor force | age > 16, the demographic groups most similar to Tohono O'odham are Pima (57.4%, a difference of 0.29%), Lumbee (56.8%, a difference of 0.85%), Yuman (57.8%, a difference of 0.99%), Navajo (56.6%, a difference of 1.2%), and Puerto Rican (58.1%, a difference of 1.5%).
| Demographics | Rating | Rank | In Labor Force | Age > 16 |
| Paiute | 0.0 /100 | #333 | Tragic 60.7% |
| Apache | 0.0 /100 | #334 | Tragic 60.7% |
| Natives/Alaskans | 0.0 /100 | #335 | Tragic 60.6% |
| Menominee | 0.0 /100 | #336 | Tragic 60.6% |
| Colville | 0.0 /100 | #337 | Tragic 59.8% |
| Immigrants | Yemen | 0.0 /100 | #338 | Tragic 59.6% |
| Houma | 0.0 /100 | #339 | Tragic 59.5% |
| Pueblo | 0.0 /100 | #340 | Tragic 59.3% |
| Hopi | 0.0 /100 | #341 | Tragic 58.4% |
| Puerto Ricans | 0.0 /100 | #342 | Tragic 58.1% |
| Yuman | 0.0 /100 | #343 | Tragic 57.8% |
| Pima | 0.0 /100 | #344 | Tragic 57.4% |
| Tohono O'odham | 0.0 /100 | #345 | Tragic 57.2% |
| Lumbee | 0.0 /100 | #346 | Tragic 56.8% |
| Navajo | 0.0 /100 | #347 | Tragic 56.6% |