Immigrants from Korea vs Portuguese Hearing Disability
COMPARE
Immigrants from Korea
Portuguese
Hearing Disability
Hearing Disability Comparison
Immigrants from Korea
Portuguese
2.7%
HEARING DISABILITY
97.5/ 100
METRIC RATING
74th/ 347
METRIC RANK
3.5%
HEARING DISABILITY
0.1/ 100
METRIC RATING
260th/ 347
METRIC RANK
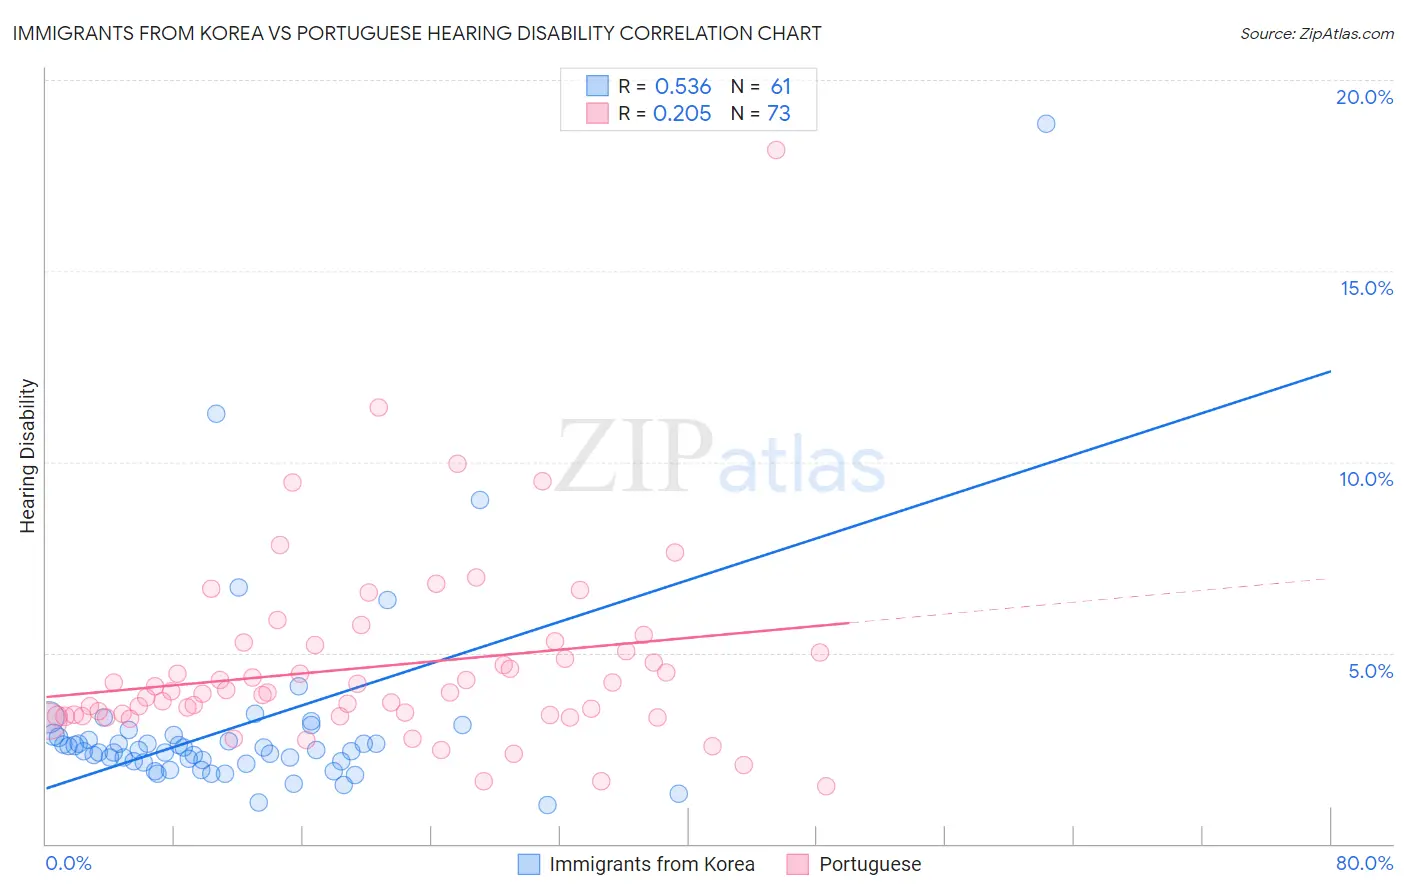
Immigrants from Korea vs Portuguese Hearing Disability Correlation Chart
The statistical analysis conducted on geographies consisting of 416,138,137 people shows a substantial positive correlation between the proportion of Immigrants from Korea and percentage of population with hearing disability in the United States with a correlation coefficient (R) of 0.536 and weighted average of 2.7%. Similarly, the statistical analysis conducted on geographies consisting of 450,060,128 people shows a weak positive correlation between the proportion of Portuguese and percentage of population with hearing disability in the United States with a correlation coefficient (R) of 0.205 and weighted average of 3.5%, a difference of 26.4%.
Hearing Disability Correlation Summary
| Measurement | Immigrants from Korea | Portuguese |
| Minimum | 1.0% | 1.5% |
| Maximum | 18.9% | 18.2% |
| Range | 17.8% | 16.7% |
| Mean | 3.1% | 4.6% |
| Median | 2.5% | 3.9% |
| Interquartile 25% (IQ1) | 2.1% | 3.4% |
| Interquartile 75% (IQ3) | 2.8% | 5.1% |
| Interquartile Range (IQR) | 0.67% | 1.8% |
| Standard Deviation (Sample) | 2.6% | 2.5% |
| Standard Deviation (Population) | 2.6% | 2.5% |
Similar Demographics by Hearing Disability
Demographics Similar to Immigrants from Korea by Hearing Disability
In terms of hearing disability, the demographic groups most similar to Immigrants from Korea are Argentinean (2.7%, a difference of 0.0%), Immigrants from Saudi Arabia (2.7%, a difference of 0.030%), Asian (2.7%, a difference of 0.030%), Immigrants from Malaysia (2.7%, a difference of 0.050%), and Afghan (2.7%, a difference of 0.080%).
| Demographics | Rating | Rank | Hearing Disability |
| Egyptians | 98.1 /100 | #67 | Exceptional 2.7% |
| Immigrants | Africa | 98.0 /100 | #68 | Exceptional 2.7% |
| Nicaraguans | 97.9 /100 | #69 | Exceptional 2.7% |
| Peruvians | 97.7 /100 | #70 | Exceptional 2.7% |
| Central Americans | 97.7 /100 | #71 | Exceptional 2.7% |
| Afghans | 97.6 /100 | #72 | Exceptional 2.7% |
| Argentineans | 97.5 /100 | #73 | Exceptional 2.7% |
| Immigrants | Korea | 97.5 /100 | #74 | Exceptional 2.7% |
| Immigrants | Saudi Arabia | 97.5 /100 | #75 | Exceptional 2.7% |
| Asians | 97.5 /100 | #76 | Exceptional 2.7% |
| Immigrants | Malaysia | 97.5 /100 | #77 | Exceptional 2.7% |
| Mongolians | 97.4 /100 | #78 | Exceptional 2.7% |
| Colombians | 97.4 /100 | #79 | Exceptional 2.7% |
| Immigrants | Asia | 97.2 /100 | #80 | Exceptional 2.7% |
| Immigrants | Uruguay | 97.2 /100 | #81 | Exceptional 2.7% |
Demographics Similar to Portuguese by Hearing Disability
In terms of hearing disability, the demographic groups most similar to Portuguese are Hawaiian (3.5%, a difference of 0.040%), Slovene (3.5%, a difference of 0.080%), Immigrants from North America (3.5%, a difference of 0.15%), Immigrants from Canada (3.5%, a difference of 0.19%), and Northern European (3.4%, a difference of 0.32%).
| Demographics | Rating | Rank | Hearing Disability |
| Carpatho Rusyns | 0.3 /100 | #253 | Tragic 3.4% |
| Slavs | 0.2 /100 | #254 | Tragic 3.4% |
| Poles | 0.2 /100 | #255 | Tragic 3.4% |
| Hmong | 0.2 /100 | #256 | Tragic 3.4% |
| Yaqui | 0.2 /100 | #257 | Tragic 3.4% |
| Northern Europeans | 0.2 /100 | #258 | Tragic 3.4% |
| Slovenes | 0.1 /100 | #259 | Tragic 3.5% |
| Portuguese | 0.1 /100 | #260 | Tragic 3.5% |
| Hawaiians | 0.1 /100 | #261 | Tragic 3.5% |
| Immigrants | North America | 0.1 /100 | #262 | Tragic 3.5% |
| Immigrants | Canada | 0.1 /100 | #263 | Tragic 3.5% |
| Immigrants | Germany | 0.1 /100 | #264 | Tragic 3.5% |
| British | 0.1 /100 | #265 | Tragic 3.5% |
| Belgians | 0.1 /100 | #266 | Tragic 3.5% |
| Canadians | 0.1 /100 | #267 | Tragic 3.5% |