Immigrants from Korea vs Bermudan In Labor Force | Age 25-29
COMPARE
Immigrants from Korea
Bermudan
In Labor Force | Age 25-29
In Labor Force | Age 25-29 Comparison
Immigrants from Korea
Bermudans
85.1%
IN LABOR FORCE | AGE 25-29
94.8/ 100
METRIC RATING
94th/ 347
METRIC RANK
86.0%
IN LABOR FORCE | AGE 25-29
100.0/ 100
METRIC RATING
17th/ 347
METRIC RANK
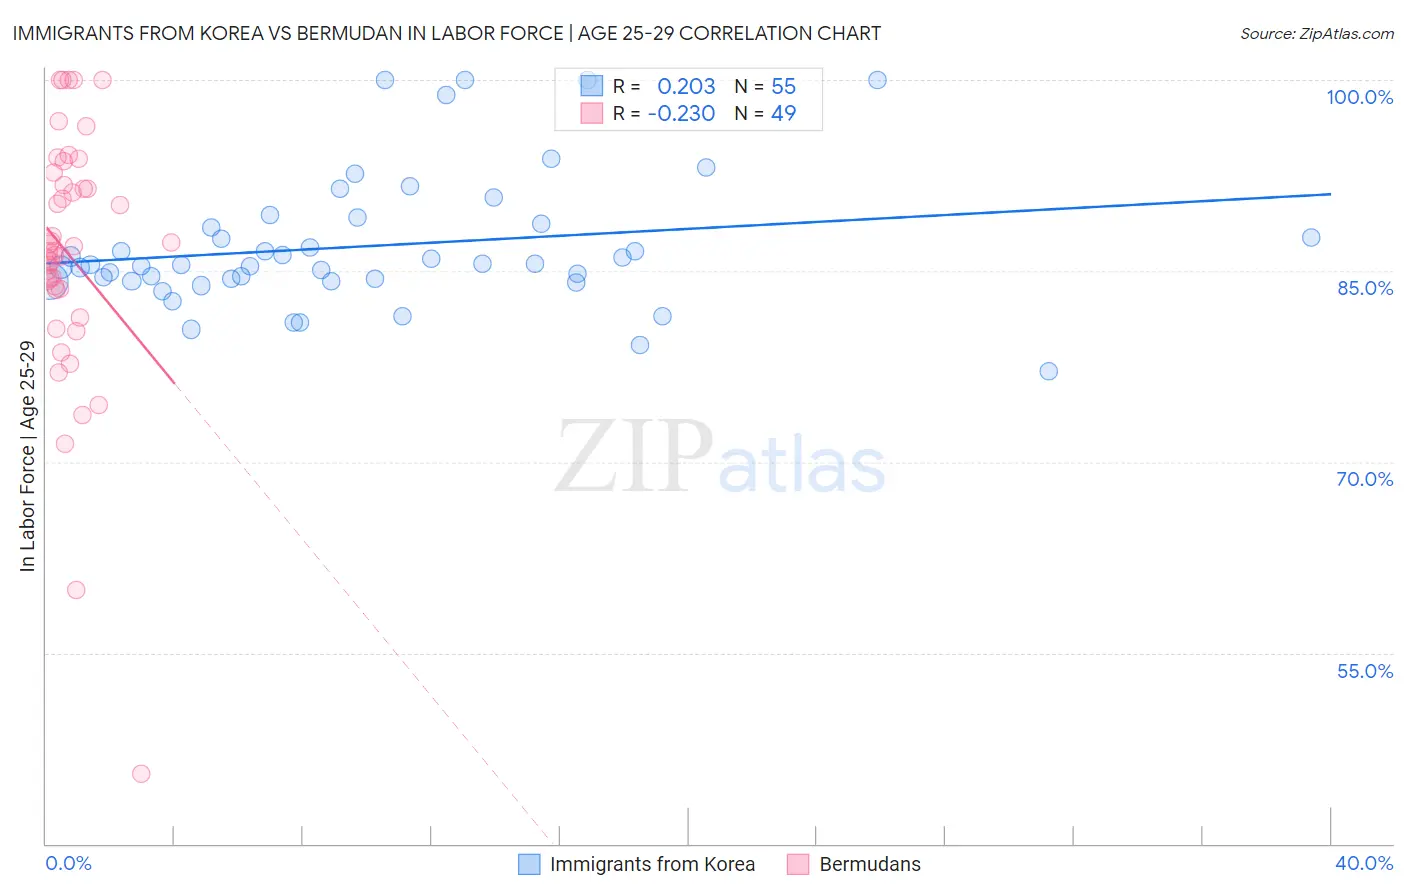
Immigrants from Korea vs Bermudan In Labor Force | Age 25-29 Correlation Chart
The statistical analysis conducted on geographies consisting of 416,167,455 people shows a weak positive correlation between the proportion of Immigrants from Korea and labor force participation rate among population between the ages 25 and 29 in the United States with a correlation coefficient (R) of 0.203 and weighted average of 85.1%. Similarly, the statistical analysis conducted on geographies consisting of 55,723,505 people shows a weak negative correlation between the proportion of Bermudans and labor force participation rate among population between the ages 25 and 29 in the United States with a correlation coefficient (R) of -0.230 and weighted average of 86.0%, a difference of 1.1%.
In Labor Force | Age 25-29 Correlation Summary
| Measurement | Immigrants from Korea | Bermudan |
| Minimum | 77.1% | 45.5% |
| Maximum | 100.0% | 100.0% |
| Range | 22.9% | 54.5% |
| Mean | 87.0% | 86.3% |
| Median | 85.5% | 86.6% |
| Interquartile 25% (IQ1) | 84.2% | 83.5% |
| Interquartile 75% (IQ3) | 88.7% | 92.2% |
| Interquartile Range (IQR) | 4.5% | 8.7% |
| Standard Deviation (Sample) | 5.2% | 10.0% |
| Standard Deviation (Population) | 5.2% | 9.9% |
Similar Demographics by In Labor Force | Age 25-29
Demographics Similar to Immigrants from Korea by In Labor Force | Age 25-29
In terms of in labor force | age 25-29, the demographic groups most similar to Immigrants from Korea are Immigrants from Netherlands (85.1%, a difference of 0.010%), Immigrants from Romania (85.1%, a difference of 0.010%), Austrian (85.1%, a difference of 0.020%), Immigrants from Sudan (85.1%, a difference of 0.020%), and Immigrants from Costa Rica (85.1%, a difference of 0.030%).
| Demographics | Rating | Rank | In Labor Force | Age 25-29 |
| French Canadians | 96.5 /100 | #87 | Exceptional 85.2% |
| Immigrants | Croatia | 96.4 /100 | #88 | Exceptional 85.2% |
| Immigrants | France | 96.3 /100 | #89 | Exceptional 85.2% |
| Burmese | 95.9 /100 | #90 | Exceptional 85.1% |
| Immigrants | Moldova | 95.8 /100 | #91 | Exceptional 85.1% |
| Immigrants | Costa Rica | 95.5 /100 | #92 | Exceptional 85.1% |
| Austrians | 95.3 /100 | #93 | Exceptional 85.1% |
| Immigrants | Korea | 94.8 /100 | #94 | Exceptional 85.1% |
| Immigrants | Netherlands | 94.6 /100 | #95 | Exceptional 85.1% |
| Immigrants | Romania | 94.6 /100 | #96 | Exceptional 85.1% |
| Immigrants | Sudan | 94.3 /100 | #97 | Exceptional 85.1% |
| Mongolians | 94.1 /100 | #98 | Exceptional 85.1% |
| Bangladeshis | 94.0 /100 | #99 | Exceptional 85.1% |
| Immigrants | Switzerland | 93.9 /100 | #100 | Exceptional 85.1% |
| Egyptians | 93.8 /100 | #101 | Exceptional 85.1% |
Demographics Similar to Bermudans by In Labor Force | Age 25-29
In terms of in labor force | age 25-29, the demographic groups most similar to Bermudans are Bulgarian (86.0%, a difference of 0.030%), Immigrants from Bolivia (86.1%, a difference of 0.040%), Cape Verdean (86.0%, a difference of 0.040%), Latvian (86.1%, a difference of 0.050%), and Bolivian (86.1%, a difference of 0.050%).
| Demographics | Rating | Rank | In Labor Force | Age 25-29 |
| Liberians | 100.0 /100 | #10 | Exceptional 86.1% |
| Immigrants | Ethiopia | 100.0 /100 | #11 | Exceptional 86.1% |
| Immigrants | Lithuania | 100.0 /100 | #12 | Exceptional 86.1% |
| Norwegians | 100.0 /100 | #13 | Exceptional 86.1% |
| Latvians | 100.0 /100 | #14 | Exceptional 86.1% |
| Bolivians | 100.0 /100 | #15 | Exceptional 86.1% |
| Immigrants | Bolivia | 100.0 /100 | #16 | Exceptional 86.1% |
| Bermudans | 100.0 /100 | #17 | Exceptional 86.0% |
| Bulgarians | 100.0 /100 | #18 | Exceptional 86.0% |
| Cape Verdeans | 100.0 /100 | #19 | Exceptional 86.0% |
| Immigrants | Ireland | 100.0 /100 | #20 | Exceptional 86.0% |
| Maltese | 100.0 /100 | #21 | Exceptional 86.0% |
| Cambodians | 100.0 /100 | #22 | Exceptional 86.0% |
| Immigrants | Uganda | 100.0 /100 | #23 | Exceptional 86.0% |
| Immigrants | Eastern Africa | 100.0 /100 | #24 | Exceptional 86.0% |