Immigrants from Kazakhstan vs Colombian In Labor Force | Age 25-29
COMPARE
Immigrants from Kazakhstan
Colombian
In Labor Force | Age 25-29
In Labor Force | Age 25-29 Comparison
Immigrants from Kazakhstan
Colombians
84.4%
IN LABOR FORCE | AGE 25-29
17.5/ 100
METRIC RATING
200th/ 347
METRIC RANK
84.7%
IN LABOR FORCE | AGE 25-29
62.8/ 100
METRIC RATING
151st/ 347
METRIC RANK
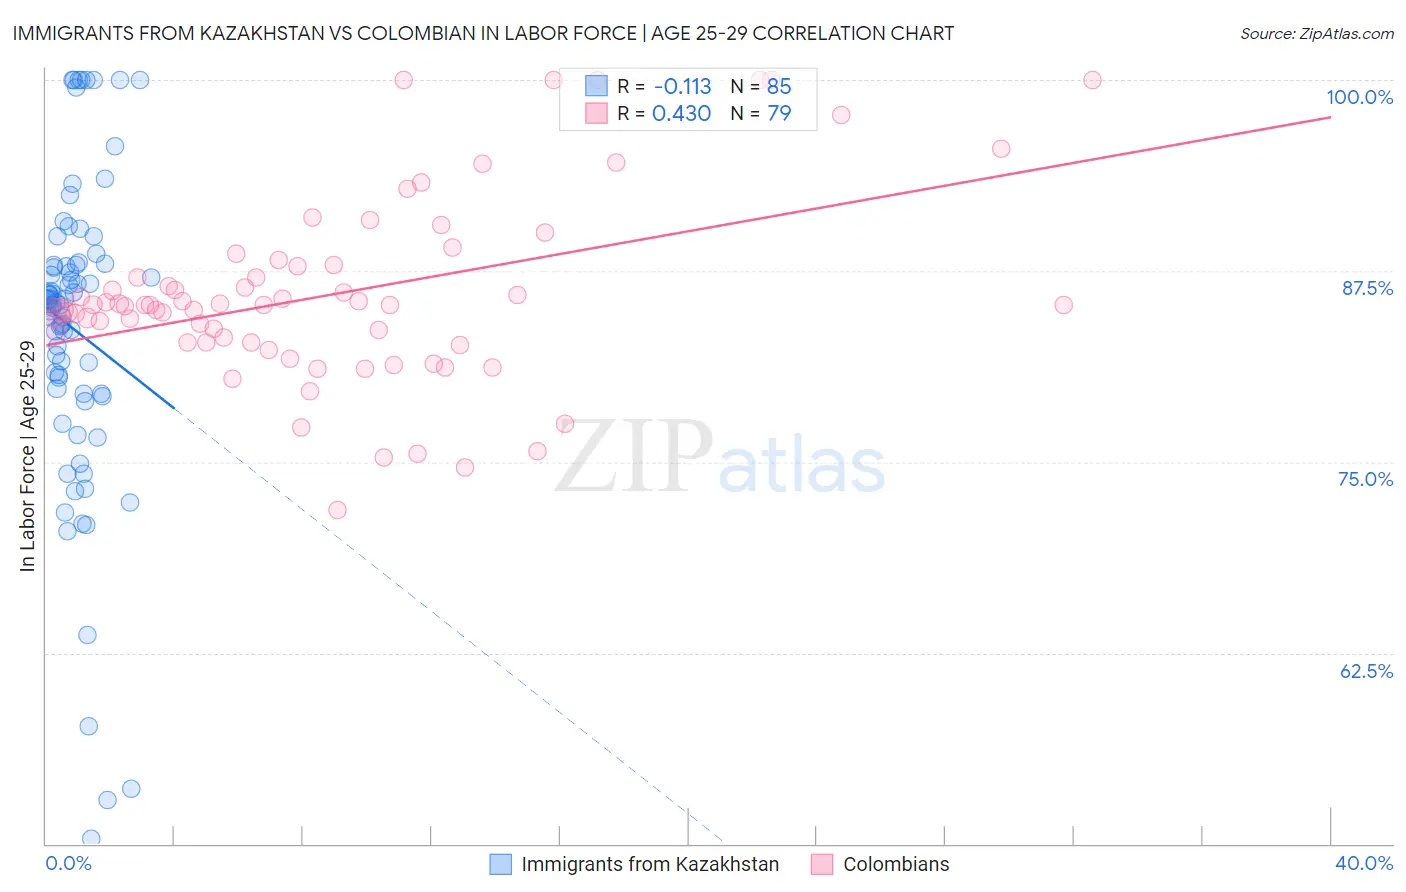
Immigrants from Kazakhstan vs Colombian In Labor Force | Age 25-29 Correlation Chart
The statistical analysis conducted on geographies consisting of 124,427,458 people shows a poor negative correlation between the proportion of Immigrants from Kazakhstan and labor force participation rate among population between the ages 25 and 29 in the United States with a correlation coefficient (R) of -0.113 and weighted average of 84.4%. Similarly, the statistical analysis conducted on geographies consisting of 419,521,460 people shows a moderate positive correlation between the proportion of Colombians and labor force participation rate among population between the ages 25 and 29 in the United States with a correlation coefficient (R) of 0.430 and weighted average of 84.7%, a difference of 0.38%.
In Labor Force | Age 25-29 Correlation Summary
| Measurement | Immigrants from Kazakhstan | Colombian |
| Minimum | 50.3% | 71.9% |
| Maximum | 100.0% | 100.0% |
| Range | 49.7% | 28.1% |
| Mean | 83.6% | 86.0% |
| Median | 85.5% | 85.3% |
| Interquartile 25% (IQ1) | 79.5% | 82.8% |
| Interquartile 75% (IQ3) | 88.0% | 87.9% |
| Interquartile Range (IQR) | 8.5% | 5.1% |
| Standard Deviation (Sample) | 10.3% | 6.1% |
| Standard Deviation (Population) | 10.2% | 6.1% |
Similar Demographics by In Labor Force | Age 25-29
Demographics Similar to Immigrants from Kazakhstan by In Labor Force | Age 25-29
In terms of in labor force | age 25-29, the demographic groups most similar to Immigrants from Kazakhstan are Immigrants from Germany (84.4%, a difference of 0.010%), Laotian (84.4%, a difference of 0.010%), Tlingit-Haida (84.4%, a difference of 0.020%), Immigrants from Iraq (84.4%, a difference of 0.020%), and Afghan (84.4%, a difference of 0.020%).
| Demographics | Rating | Rank | In Labor Force | Age 25-29 |
| South American Indians | 25.0 /100 | #193 | Fair 84.5% |
| Portuguese | 21.2 /100 | #194 | Fair 84.4% |
| Immigrants | Israel | 20.8 /100 | #195 | Fair 84.4% |
| Immigrants | South Eastern Asia | 19.5 /100 | #196 | Poor 84.4% |
| Tlingit-Haida | 19.3 /100 | #197 | Poor 84.4% |
| Immigrants | Iraq | 19.0 /100 | #198 | Poor 84.4% |
| Immigrants | Germany | 18.3 /100 | #199 | Poor 84.4% |
| Immigrants | Kazakhstan | 17.5 /100 | #200 | Poor 84.4% |
| Laotians | 16.6 /100 | #201 | Poor 84.4% |
| Afghans | 15.9 /100 | #202 | Poor 84.4% |
| Immigrants | Afghanistan | 15.6 /100 | #203 | Poor 84.4% |
| Venezuelans | 15.1 /100 | #204 | Poor 84.4% |
| Ecuadorians | 14.8 /100 | #205 | Poor 84.4% |
| Immigrants | Cambodia | 14.3 /100 | #206 | Poor 84.4% |
| Immigrants | Armenia | 13.3 /100 | #207 | Poor 84.4% |
Demographics Similar to Colombians by In Labor Force | Age 25-29
In terms of in labor force | age 25-29, the demographic groups most similar to Colombians are Immigrants from Pakistan (84.7%, a difference of 0.0%), Immigrants from Taiwan (84.7%, a difference of 0.0%), Peruvian (84.7%, a difference of 0.010%), Swiss (84.7%, a difference of 0.010%), and Immigrants from Sri Lanka (84.7%, a difference of 0.010%).
| Demographics | Rating | Rank | In Labor Force | Age 25-29 |
| Immigrants | Laos | 69.0 /100 | #144 | Good 84.8% |
| Immigrants | Senegal | 68.3 /100 | #145 | Good 84.8% |
| Icelanders | 68.2 /100 | #146 | Good 84.8% |
| Immigrants | Asia | 68.2 /100 | #147 | Good 84.8% |
| Immigrants | England | 65.2 /100 | #148 | Good 84.7% |
| Peruvians | 64.7 /100 | #149 | Good 84.7% |
| Swiss | 64.7 /100 | #150 | Good 84.7% |
| Colombians | 62.8 /100 | #151 | Good 84.7% |
| Immigrants | Pakistan | 62.7 /100 | #152 | Good 84.7% |
| Immigrants | Taiwan | 62.2 /100 | #153 | Good 84.7% |
| Immigrants | Sri Lanka | 61.7 /100 | #154 | Good 84.7% |
| Indians (Asian) | 61.6 /100 | #155 | Good 84.7% |
| French | 61.0 /100 | #156 | Good 84.7% |
| British | 60.4 /100 | #157 | Good 84.7% |
| Immigrants | Ghana | 60.2 /100 | #158 | Good 84.7% |