Immigrants from Eastern Africa vs Immigrants from Eastern Europe In Labor Force | Age 35-44
COMPARE
Immigrants from Eastern Africa
Immigrants from Eastern Europe
In Labor Force | Age 35-44
In Labor Force | Age 35-44 Comparison
Immigrants from Eastern Africa
Immigrants from Eastern Europe
85.4%
IN LABOR FORCE | AGE 35-44
100.0/ 100
METRIC RATING
23rd/ 347
METRIC RANK
84.9%
IN LABOR FORCE | AGE 35-44
98.3/ 100
METRIC RATING
81st/ 347
METRIC RANK
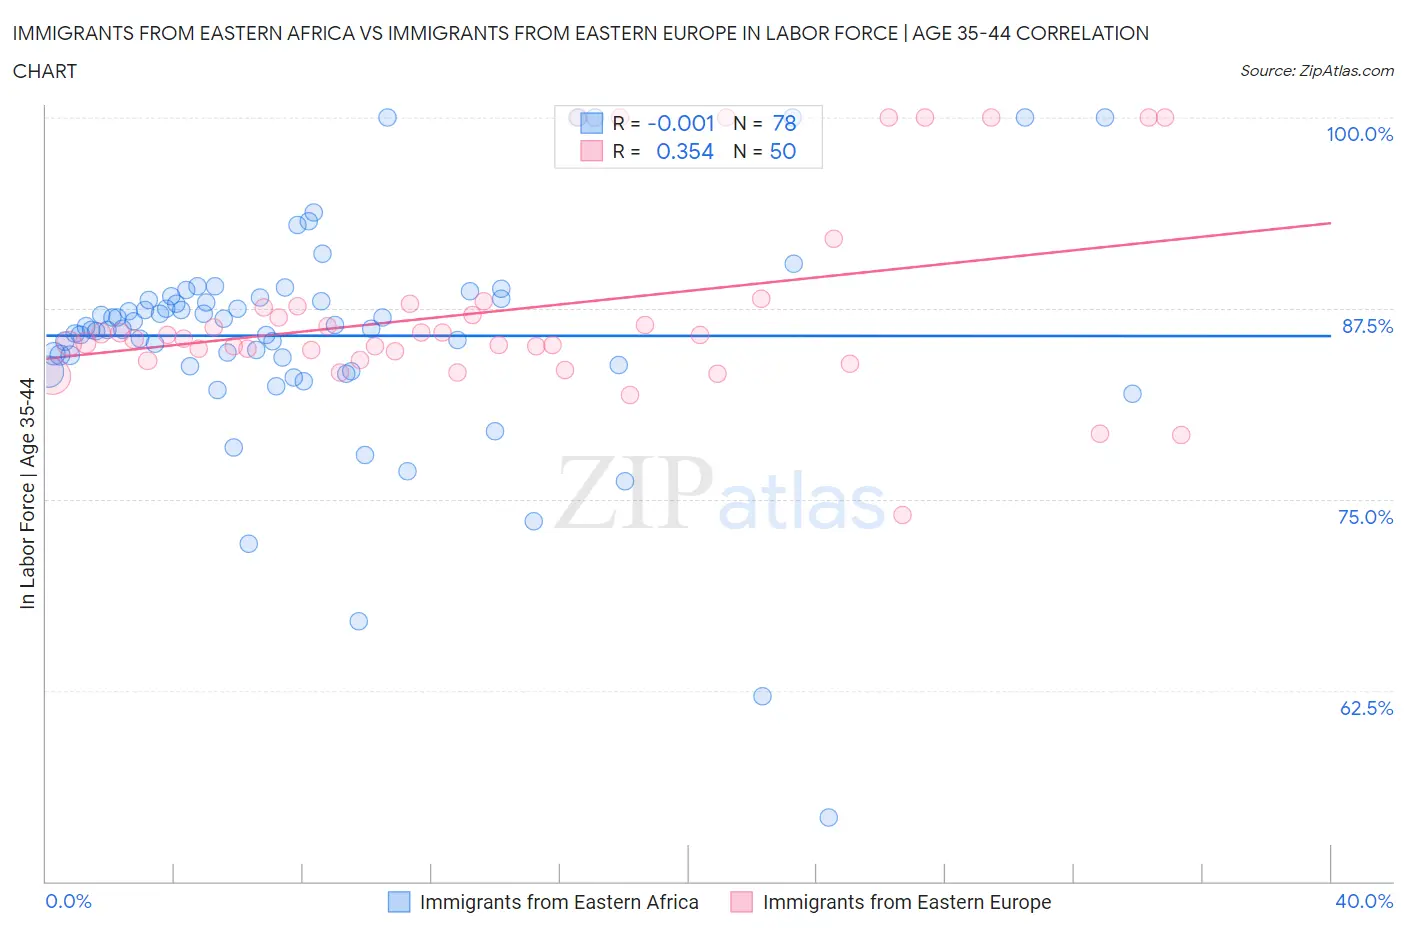
Immigrants from Eastern Africa vs Immigrants from Eastern Europe In Labor Force | Age 35-44 Correlation Chart
The statistical analysis conducted on geographies consisting of 354,984,376 people shows no correlation between the proportion of Immigrants from Eastern Africa and labor force participation rate among population between the ages 35 and 44 in the United States with a correlation coefficient (R) of -0.001 and weighted average of 85.4%. Similarly, the statistical analysis conducted on geographies consisting of 475,561,488 people shows a mild positive correlation between the proportion of Immigrants from Eastern Europe and labor force participation rate among population between the ages 35 and 44 in the United States with a correlation coefficient (R) of 0.354 and weighted average of 84.9%, a difference of 0.59%.
In Labor Force | Age 35-44 Correlation Summary
| Measurement | Immigrants from Eastern Africa | Immigrants from Eastern Europe |
| Minimum | 54.2% | 74.0% |
| Maximum | 100.0% | 100.0% |
| Range | 45.8% | 26.0% |
| Mean | 85.7% | 87.4% |
| Median | 86.2% | 85.6% |
| Interquartile 25% (IQ1) | 83.8% | 84.7% |
| Interquartile 75% (IQ3) | 88.1% | 87.6% |
| Interquartile Range (IQR) | 4.3% | 2.9% |
| Standard Deviation (Sample) | 7.4% | 6.1% |
| Standard Deviation (Population) | 7.4% | 6.1% |
Similar Demographics by In Labor Force | Age 35-44
Demographics Similar to Immigrants from Eastern Africa by In Labor Force | Age 35-44
In terms of in labor force | age 35-44, the demographic groups most similar to Immigrants from Eastern Africa are Immigrants from Bosnia and Herzegovina (85.4%, a difference of 0.020%), Bulgarian (85.5%, a difference of 0.060%), Latvian (85.4%, a difference of 0.060%), Paraguayan (85.4%, a difference of 0.070%), and Immigrants from Liberia (85.4%, a difference of 0.070%).
| Demographics | Rating | Rank | In Labor Force | Age 35-44 |
| Immigrants | Ireland | 100.0 /100 | #16 | Exceptional 85.6% |
| Immigrants | North Macedonia | 100.0 /100 | #17 | Exceptional 85.6% |
| Carpatho Rusyns | 100.0 /100 | #18 | Exceptional 85.6% |
| Slovenes | 100.0 /100 | #19 | Exceptional 85.6% |
| Immigrants | Serbia | 100.0 /100 | #20 | Exceptional 85.5% |
| Bulgarians | 100.0 /100 | #21 | Exceptional 85.5% |
| Immigrants | Bosnia and Herzegovina | 100.0 /100 | #22 | Exceptional 85.4% |
| Immigrants | Eastern Africa | 100.0 /100 | #23 | Exceptional 85.4% |
| Latvians | 99.9 /100 | #24 | Exceptional 85.4% |
| Paraguayans | 99.9 /100 | #25 | Exceptional 85.4% |
| Immigrants | Liberia | 99.9 /100 | #26 | Exceptional 85.4% |
| Immigrants | Lithuania | 99.9 /100 | #27 | Exceptional 85.4% |
| Immigrants | Greece | 99.9 /100 | #28 | Exceptional 85.3% |
| Cambodians | 99.9 /100 | #29 | Exceptional 85.3% |
| Bermudans | 99.9 /100 | #30 | Exceptional 85.3% |
Demographics Similar to Immigrants from Eastern Europe by In Labor Force | Age 35-44
In terms of in labor force | age 35-44, the demographic groups most similar to Immigrants from Eastern Europe are Peruvian (84.9%, a difference of 0.0%), Immigrants from Colombia (84.9%, a difference of 0.0%), Immigrants from Africa (84.9%, a difference of 0.010%), Immigrants from Sudan (84.9%, a difference of 0.020%), and Immigrants from Turkey (84.9%, a difference of 0.030%).
| Demographics | Rating | Rank | In Labor Force | Age 35-44 |
| Colombians | 98.8 /100 | #74 | Exceptional 85.0% |
| Immigrants | South Central Asia | 98.7 /100 | #75 | Exceptional 85.0% |
| Immigrants | Cuba | 98.6 /100 | #76 | Exceptional 84.9% |
| Immigrants | Turkey | 98.6 /100 | #77 | Exceptional 84.9% |
| Immigrants | Africa | 98.4 /100 | #78 | Exceptional 84.9% |
| Peruvians | 98.3 /100 | #79 | Exceptional 84.9% |
| Immigrants | Colombia | 98.3 /100 | #80 | Exceptional 84.9% |
| Immigrants | Eastern Europe | 98.3 /100 | #81 | Exceptional 84.9% |
| Immigrants | Sudan | 98.1 /100 | #82 | Exceptional 84.9% |
| Senegalese | 97.8 /100 | #83 | Exceptional 84.9% |
| Immigrants | Peru | 97.8 /100 | #84 | Exceptional 84.9% |
| Immigrants | Middle Africa | 97.8 /100 | #85 | Exceptional 84.9% |
| Greeks | 97.8 /100 | #86 | Exceptional 84.9% |
| Belgians | 97.7 /100 | #87 | Exceptional 84.9% |
| Yugoslavians | 97.7 /100 | #88 | Exceptional 84.9% |