Immigrants from Jordan vs Puerto Rican In Labor Force | Age 45-54
COMPARE
Immigrants from Jordan
Puerto Rican
In Labor Force | Age 45-54
In Labor Force | Age 45-54 Comparison
Immigrants from Jordan
Puerto Ricans
83.1%
IN LABOR FORCE | AGE 45-54
85.2/ 100
METRIC RATING
127th/ 347
METRIC RANK
75.9%
IN LABOR FORCE | AGE 45-54
0.0/ 100
METRIC RATING
339th/ 347
METRIC RANK
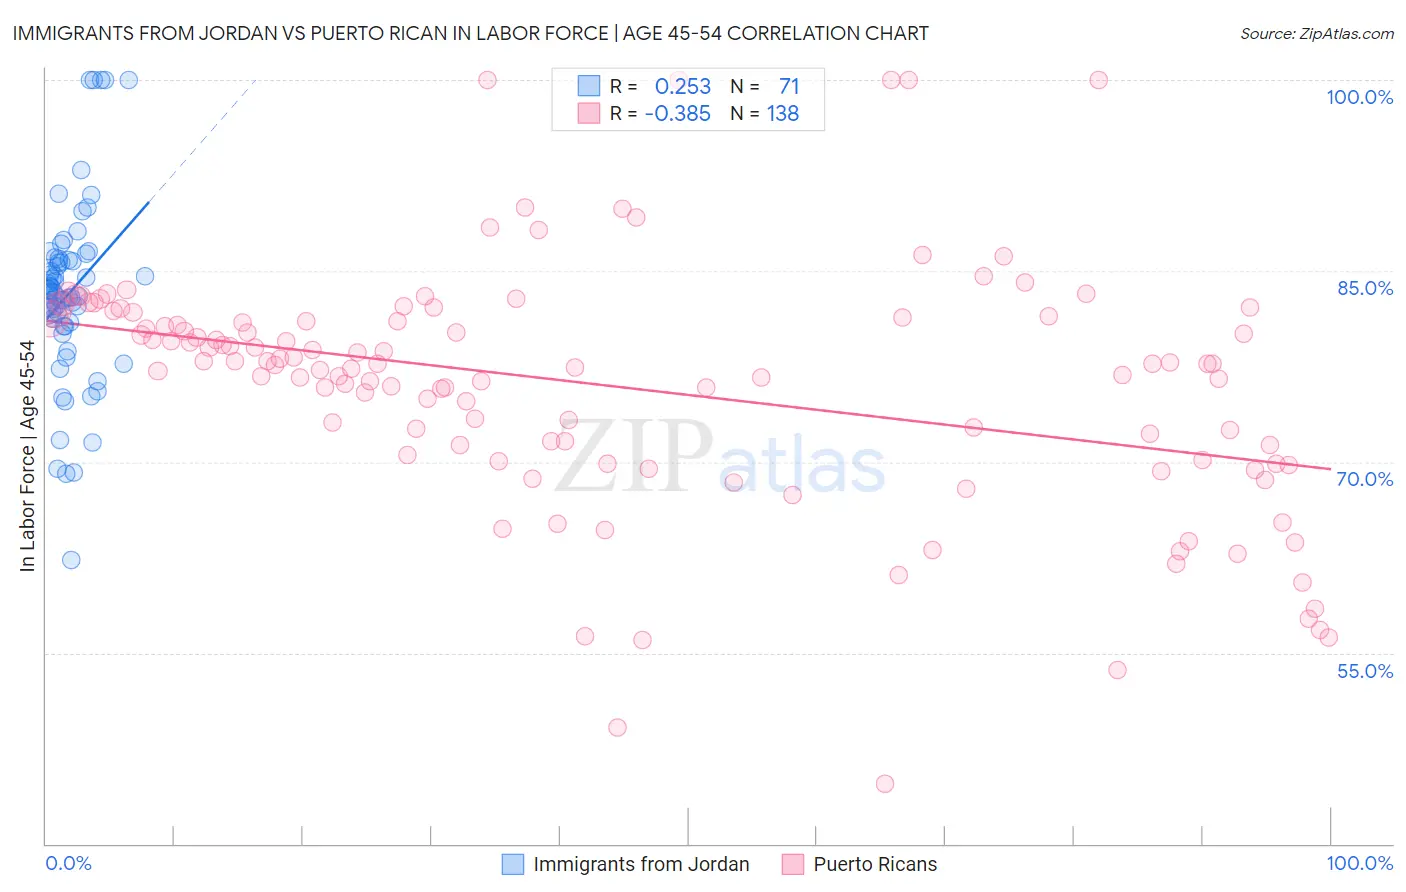
Immigrants from Jordan vs Puerto Rican In Labor Force | Age 45-54 Correlation Chart
The statistical analysis conducted on geographies consisting of 181,248,316 people shows a weak positive correlation between the proportion of Immigrants from Jordan and labor force participation rate among population between the ages 45 and 54 in the United States with a correlation coefficient (R) of 0.253 and weighted average of 83.1%. Similarly, the statistical analysis conducted on geographies consisting of 527,669,276 people shows a mild negative correlation between the proportion of Puerto Ricans and labor force participation rate among population between the ages 45 and 54 in the United States with a correlation coefficient (R) of -0.385 and weighted average of 75.9%, a difference of 9.4%.
In Labor Force | Age 45-54 Correlation Summary
| Measurement | Immigrants from Jordan | Puerto Rican |
| Minimum | 62.3% | 44.7% |
| Maximum | 100.0% | 100.0% |
| Range | 37.7% | 55.3% |
| Mean | 83.3% | 76.0% |
| Median | 83.3% | 77.7% |
| Interquartile 25% (IQ1) | 80.6% | 70.5% |
| Interquartile 75% (IQ3) | 86.0% | 81.4% |
| Interquartile Range (IQR) | 5.3% | 10.9% |
| Standard Deviation (Sample) | 7.2% | 9.6% |
| Standard Deviation (Population) | 7.1% | 9.5% |
Similar Demographics by In Labor Force | Age 45-54
Demographics Similar to Immigrants from Jordan by In Labor Force | Age 45-54
In terms of in labor force | age 45-54, the demographic groups most similar to Immigrants from Jordan are German (83.1%, a difference of 0.0%), Immigrants from Northern Europe (83.1%, a difference of 0.0%), Immigrants from Israel (83.1%, a difference of 0.010%), Immigrants from Belgium (83.1%, a difference of 0.020%), and Finnish (83.1%, a difference of 0.030%).
| Demographics | Rating | Rank | In Labor Force | Age 45-54 |
| Immigrants | Russia | 90.1 /100 | #120 | Exceptional 83.2% |
| Uruguayans | 89.4 /100 | #121 | Excellent 83.1% |
| Immigrants | Vietnam | 88.9 /100 | #122 | Excellent 83.1% |
| Tongans | 88.2 /100 | #123 | Excellent 83.1% |
| Bermudans | 88.0 /100 | #124 | Excellent 83.1% |
| Immigrants | Iran | 87.2 /100 | #125 | Excellent 83.1% |
| Immigrants | Belgium | 86.4 /100 | #126 | Excellent 83.1% |
| Immigrants | Jordan | 85.2 /100 | #127 | Excellent 83.1% |
| Germans | 85.1 /100 | #128 | Excellent 83.1% |
| Immigrants | Northern Europe | 85.1 /100 | #129 | Excellent 83.1% |
| Immigrants | Israel | 84.7 /100 | #130 | Excellent 83.1% |
| Finns | 83.3 /100 | #131 | Excellent 83.1% |
| Immigrants | Ukraine | 82.9 /100 | #132 | Excellent 83.0% |
| Liberians | 82.7 /100 | #133 | Excellent 83.0% |
| Sudanese | 82.0 /100 | #134 | Excellent 83.0% |
Demographics Similar to Puerto Ricans by In Labor Force | Age 45-54
In terms of in labor force | age 45-54, the demographic groups most similar to Puerto Ricans are Lumbee (75.6%, a difference of 0.46%), Yuman (76.3%, a difference of 0.48%), Pueblo (75.5%, a difference of 0.58%), Ute (76.6%, a difference of 0.89%), and Paiute (76.7%, a difference of 0.95%).
| Demographics | Rating | Rank | In Labor Force | Age 45-54 |
| Menominee | 0.0 /100 | #332 | Tragic 77.4% |
| Natives/Alaskans | 0.0 /100 | #333 | Tragic 77.1% |
| Apache | 0.0 /100 | #334 | Tragic 77.1% |
| Arapaho | 0.0 /100 | #335 | Tragic 77.1% |
| Paiute | 0.0 /100 | #336 | Tragic 76.7% |
| Ute | 0.0 /100 | #337 | Tragic 76.6% |
| Yuman | 0.0 /100 | #338 | Tragic 76.3% |
| Puerto Ricans | 0.0 /100 | #339 | Tragic 75.9% |
| Lumbee | 0.0 /100 | #340 | Tragic 75.6% |
| Pueblo | 0.0 /100 | #341 | Tragic 75.5% |
| Tohono O'odham | 0.0 /100 | #342 | Tragic 75.1% |
| Hopi | 0.0 /100 | #343 | Tragic 75.0% |
| Immigrants | Yemen | 0.0 /100 | #344 | Tragic 74.4% |
| Houma | 0.0 /100 | #345 | Tragic 74.1% |
| Pima | 0.0 /100 | #346 | Tragic 72.8% |