Immigrants from Japan vs Arab Female Poverty Among 25-34 Year Olds
COMPARE
Immigrants from Japan
Arab
Female Poverty Among 25-34 Year Olds
Female Poverty Among 25-34 Year Olds Comparison
Immigrants from Japan
Arabs
11.6%
FEMALE POVERTY AMONG 25-34 YEAR OLDS
99.9/ 100
METRIC RATING
31st/ 347
METRIC RANK
13.2%
FEMALE POVERTY AMONG 25-34 YEAR OLDS
73.5/ 100
METRIC RATING
154th/ 347
METRIC RANK
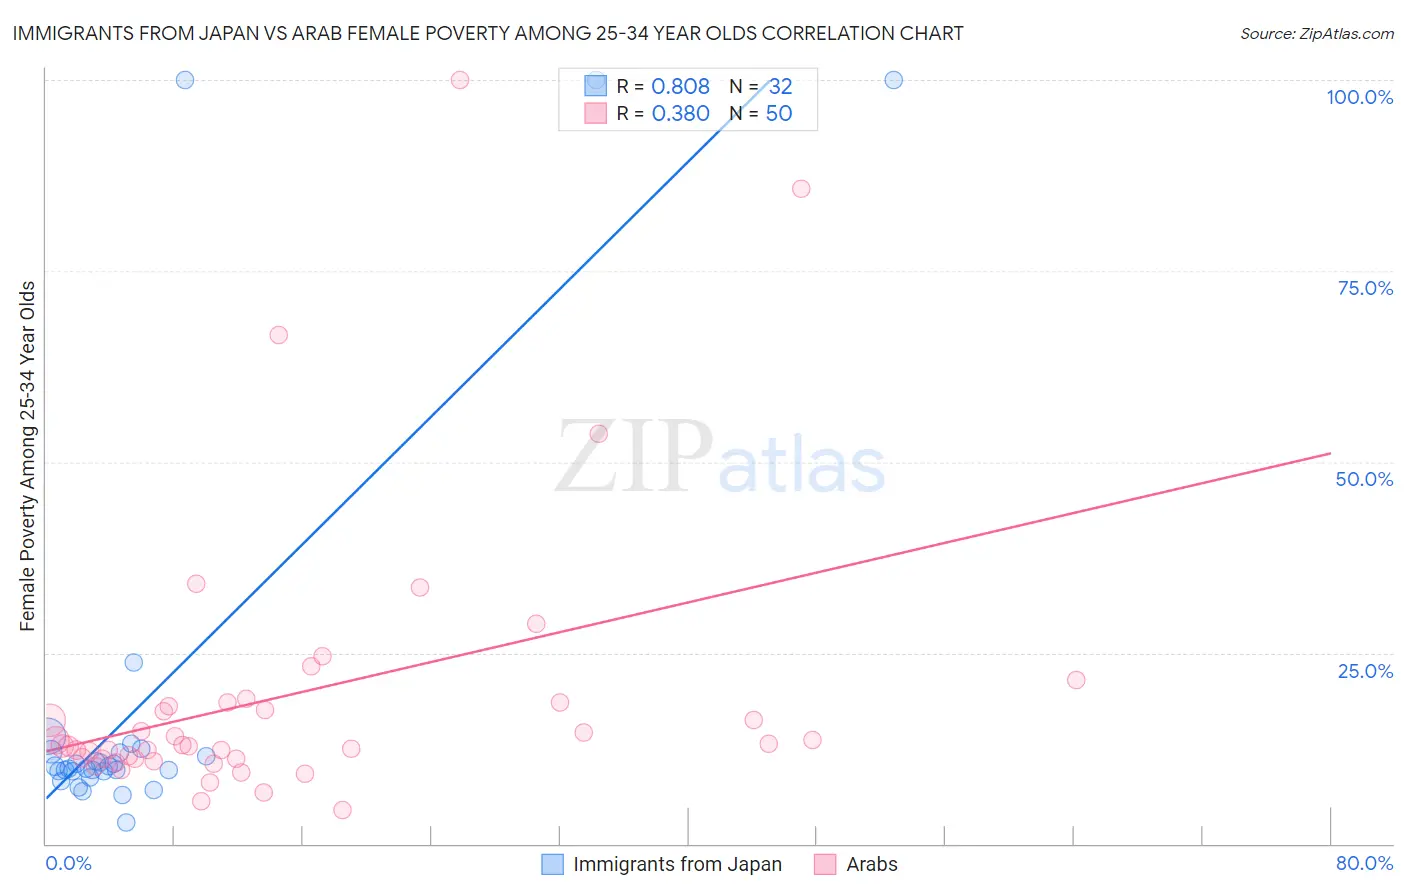
Immigrants from Japan vs Arab Female Poverty Among 25-34 Year Olds Correlation Chart
The statistical analysis conducted on geographies consisting of 335,631,961 people shows a very strong positive correlation between the proportion of Immigrants from Japan and poverty level among females between the ages 25 and 34 in the United States with a correlation coefficient (R) of 0.808 and weighted average of 11.6%. Similarly, the statistical analysis conducted on geographies consisting of 475,444,575 people shows a mild positive correlation between the proportion of Arabs and poverty level among females between the ages 25 and 34 in the United States with a correlation coefficient (R) of 0.380 and weighted average of 13.2%, a difference of 14.6%.
Female Poverty Among 25-34 Year Olds Correlation Summary
| Measurement | Immigrants from Japan | Arab |
| Minimum | 2.8% | 4.3% |
| Maximum | 100.0% | 100.0% |
| Range | 97.3% | 95.7% |
| Mean | 18.6% | 19.5% |
| Median | 10.0% | 12.8% |
| Interquartile 25% (IQ1) | 9.4% | 11.1% |
| Interquartile 75% (IQ3) | 12.0% | 18.4% |
| Interquartile Range (IQR) | 2.5% | 7.3% |
| Standard Deviation (Sample) | 26.8% | 18.7% |
| Standard Deviation (Population) | 26.4% | 18.5% |
Similar Demographics by Female Poverty Among 25-34 Year Olds
Demographics Similar to Immigrants from Japan by Female Poverty Among 25-34 Year Olds
In terms of female poverty among 25-34 year olds, the demographic groups most similar to Immigrants from Japan are Cypriot (11.5%, a difference of 0.29%), Immigrants from Asia (11.6%, a difference of 0.30%), Bulgarian (11.5%, a difference of 0.31%), Immigrants from Pakistan (11.5%, a difference of 0.32%), and Immigrants from Greece (11.5%, a difference of 0.55%).
| Demographics | Rating | Rank | Female Poverty Among 25-34 Year Olds |
| Maltese | 99.9 /100 | #24 | Exceptional 11.4% |
| Bhutanese | 99.9 /100 | #25 | Exceptional 11.4% |
| Tongans | 99.9 /100 | #26 | Exceptional 11.5% |
| Immigrants | Greece | 99.9 /100 | #27 | Exceptional 11.5% |
| Immigrants | Pakistan | 99.9 /100 | #28 | Exceptional 11.5% |
| Bulgarians | 99.9 /100 | #29 | Exceptional 11.5% |
| Cypriots | 99.9 /100 | #30 | Exceptional 11.5% |
| Immigrants | Japan | 99.9 /100 | #31 | Exceptional 11.6% |
| Immigrants | Asia | 99.9 /100 | #32 | Exceptional 11.6% |
| Immigrants | Poland | 99.9 /100 | #33 | Exceptional 11.6% |
| Zimbabweans | 99.9 /100 | #34 | Exceptional 11.7% |
| Cambodians | 99.9 /100 | #35 | Exceptional 11.7% |
| Immigrants | Sri Lanka | 99.8 /100 | #36 | Exceptional 11.8% |
| Taiwanese | 99.8 /100 | #37 | Exceptional 11.8% |
| Immigrants | North Macedonia | 99.8 /100 | #38 | Exceptional 11.8% |
Demographics Similar to Arabs by Female Poverty Among 25-34 Year Olds
In terms of female poverty among 25-34 year olds, the demographic groups most similar to Arabs are Northern European (13.2%, a difference of 0.020%), Immigrants from Sierra Leone (13.3%, a difference of 0.070%), Immigrants from Cameroon (13.3%, a difference of 0.16%), Slavic (13.2%, a difference of 0.25%), and Costa Rican (13.2%, a difference of 0.26%).
| Demographics | Rating | Rank | Female Poverty Among 25-34 Year Olds |
| Europeans | 76.8 /100 | #147 | Good 13.2% |
| Lebanese | 76.8 /100 | #148 | Good 13.2% |
| Sierra Leoneans | 76.3 /100 | #149 | Good 13.2% |
| Iraqis | 76.0 /100 | #150 | Good 13.2% |
| Costa Ricans | 75.8 /100 | #151 | Good 13.2% |
| Slavs | 75.7 /100 | #152 | Good 13.2% |
| Northern Europeans | 73.7 /100 | #153 | Good 13.2% |
| Arabs | 73.5 /100 | #154 | Good 13.2% |
| Immigrants | Sierra Leone | 72.9 /100 | #155 | Good 13.3% |
| Immigrants | Cameroon | 72.0 /100 | #156 | Good 13.3% |
| Immigrants | Western Europe | 70.3 /100 | #157 | Good 13.3% |
| Immigrants | Colombia | 69.2 /100 | #158 | Good 13.3% |
| Uruguayans | 66.9 /100 | #159 | Good 13.3% |
| Immigrants | South America | 66.3 /100 | #160 | Good 13.3% |
| Icelanders | 65.7 /100 | #161 | Good 13.3% |