Immigrants from Ireland vs American In Labor Force | Age 45-54
COMPARE
Immigrants from Ireland
American
In Labor Force | Age 45-54
In Labor Force | Age 45-54 Comparison
Immigrants from Ireland
Americans
83.9%
IN LABOR FORCE | AGE 45-54
99.8/ 100
METRIC RATING
22nd/ 347
METRIC RANK
80.4%
IN LABOR FORCE | AGE 45-54
0.0/ 100
METRIC RATING
297th/ 347
METRIC RANK
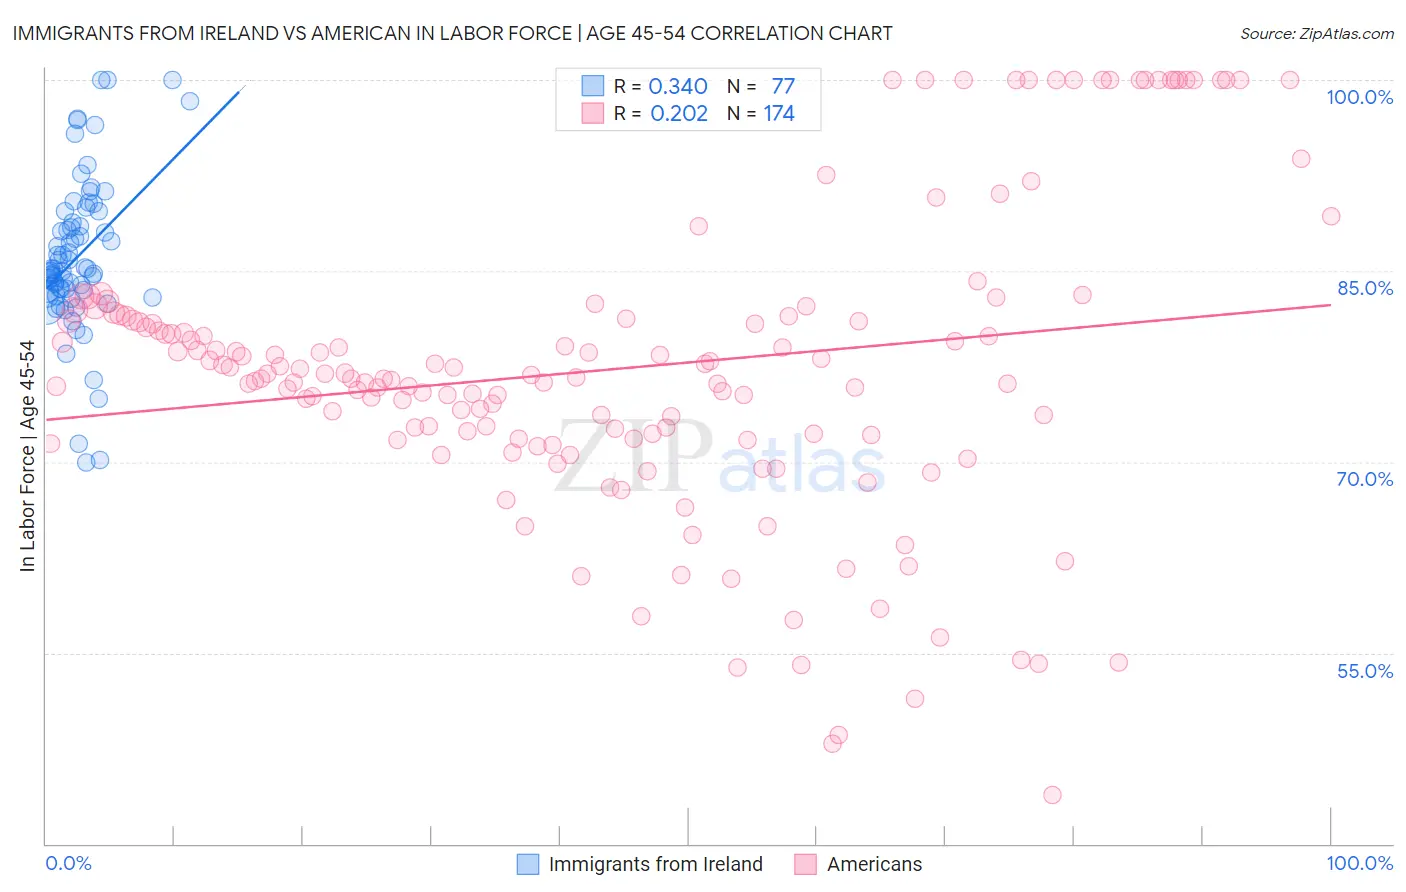
Immigrants from Ireland vs American In Labor Force | Age 45-54 Correlation Chart
The statistical analysis conducted on geographies consisting of 240,747,816 people shows a mild positive correlation between the proportion of Immigrants from Ireland and labor force participation rate among population between the ages 45 and 54 in the United States with a correlation coefficient (R) of 0.340 and weighted average of 83.9%. Similarly, the statistical analysis conducted on geographies consisting of 581,101,031 people shows a weak positive correlation between the proportion of Americans and labor force participation rate among population between the ages 45 and 54 in the United States with a correlation coefficient (R) of 0.202 and weighted average of 80.4%, a difference of 4.4%.
In Labor Force | Age 45-54 Correlation Summary
| Measurement | Immigrants from Ireland | American |
| Minimum | 70.0% | 43.8% |
| Maximum | 100.0% | 100.0% |
| Range | 30.0% | 56.2% |
| Mean | 86.1% | 77.3% |
| Median | 85.1% | 76.6% |
| Interquartile 25% (IQ1) | 83.2% | 71.8% |
| Interquartile 75% (IQ3) | 89.2% | 81.3% |
| Interquartile Range (IQR) | 6.0% | 9.5% |
| Standard Deviation (Sample) | 6.1% | 11.8% |
| Standard Deviation (Population) | 6.0% | 11.8% |
Similar Demographics by In Labor Force | Age 45-54
Demographics Similar to Immigrants from Ireland by In Labor Force | Age 45-54
In terms of in labor force | age 45-54, the demographic groups most similar to Immigrants from Ireland are Immigrants from Eastern Africa (83.9%, a difference of 0.0%), Immigrants from Sri Lanka (83.9%, a difference of 0.0%), Tlingit-Haida (83.9%, a difference of 0.0%), Czech (83.9%, a difference of 0.010%), and Slovene (83.9%, a difference of 0.010%).
| Demographics | Rating | Rank | In Labor Force | Age 45-54 |
| Cypriots | 99.9 /100 | #15 | Exceptional 84.1% |
| Immigrants | Nepal | 99.9 /100 | #16 | Exceptional 84.0% |
| Zimbabweans | 99.9 /100 | #17 | Exceptional 84.0% |
| Immigrants | South Central Asia | 99.9 /100 | #18 | Exceptional 84.0% |
| Czechs | 99.8 /100 | #19 | Exceptional 83.9% |
| Immigrants | Eastern Africa | 99.8 /100 | #20 | Exceptional 83.9% |
| Immigrants | Sri Lanka | 99.8 /100 | #21 | Exceptional 83.9% |
| Immigrants | Ireland | 99.8 /100 | #22 | Exceptional 83.9% |
| Tlingit-Haida | 99.8 /100 | #23 | Exceptional 83.9% |
| Slovenes | 99.8 /100 | #24 | Exceptional 83.9% |
| Immigrants | North Macedonia | 99.8 /100 | #25 | Exceptional 83.9% |
| Immigrants | Serbia | 99.8 /100 | #26 | Exceptional 83.9% |
| Immigrants | Brazil | 99.8 /100 | #27 | Exceptional 83.9% |
| Immigrants | Lithuania | 99.8 /100 | #28 | Exceptional 83.9% |
| Immigrants | Pakistan | 99.7 /100 | #29 | Exceptional 83.8% |
Demographics Similar to Americans by In Labor Force | Age 45-54
In terms of in labor force | age 45-54, the demographic groups most similar to Americans are Marshallese (80.3%, a difference of 0.040%), Dominican (80.3%, a difference of 0.15%), Fijian (80.2%, a difference of 0.15%), Spanish American Indian (80.2%, a difference of 0.17%), and African (80.5%, a difference of 0.18%).
| Demographics | Rating | Rank | In Labor Force | Age 45-54 |
| Mexican American Indians | 0.0 /100 | #290 | Tragic 80.7% |
| Immigrants | Belize | 0.0 /100 | #291 | Tragic 80.6% |
| Iroquois | 0.0 /100 | #292 | Tragic 80.6% |
| Osage | 0.0 /100 | #293 | Tragic 80.6% |
| Yakama | 0.0 /100 | #294 | Tragic 80.6% |
| Nepalese | 0.0 /100 | #295 | Tragic 80.5% |
| Africans | 0.0 /100 | #296 | Tragic 80.5% |
| Americans | 0.0 /100 | #297 | Tragic 80.4% |
| Marshallese | 0.0 /100 | #298 | Tragic 80.3% |
| Dominicans | 0.0 /100 | #299 | Tragic 80.3% |
| Fijians | 0.0 /100 | #300 | Tragic 80.2% |
| Spanish American Indians | 0.0 /100 | #301 | Tragic 80.2% |
| Immigrants | Central America | 0.0 /100 | #302 | Tragic 80.2% |
| Immigrants | Azores | 0.0 /100 | #303 | Tragic 80.1% |
| Hispanics or Latinos | 0.0 /100 | #304 | Tragic 80.1% |