Immigrants from Iraq vs Immigrants from Morocco In Labor Force | Age 30-34
COMPARE
Immigrants from Iraq
Immigrants from Morocco
In Labor Force | Age 30-34
In Labor Force | Age 30-34 Comparison
Immigrants from Iraq
Immigrants from Morocco
83.9%
IN LABOR FORCE | AGE 30-34
0.7/ 100
METRIC RATING
250th/ 347
METRIC RANK
85.6%
IN LABOR FORCE | AGE 30-34
99.8/ 100
METRIC RATING
46th/ 347
METRIC RANK
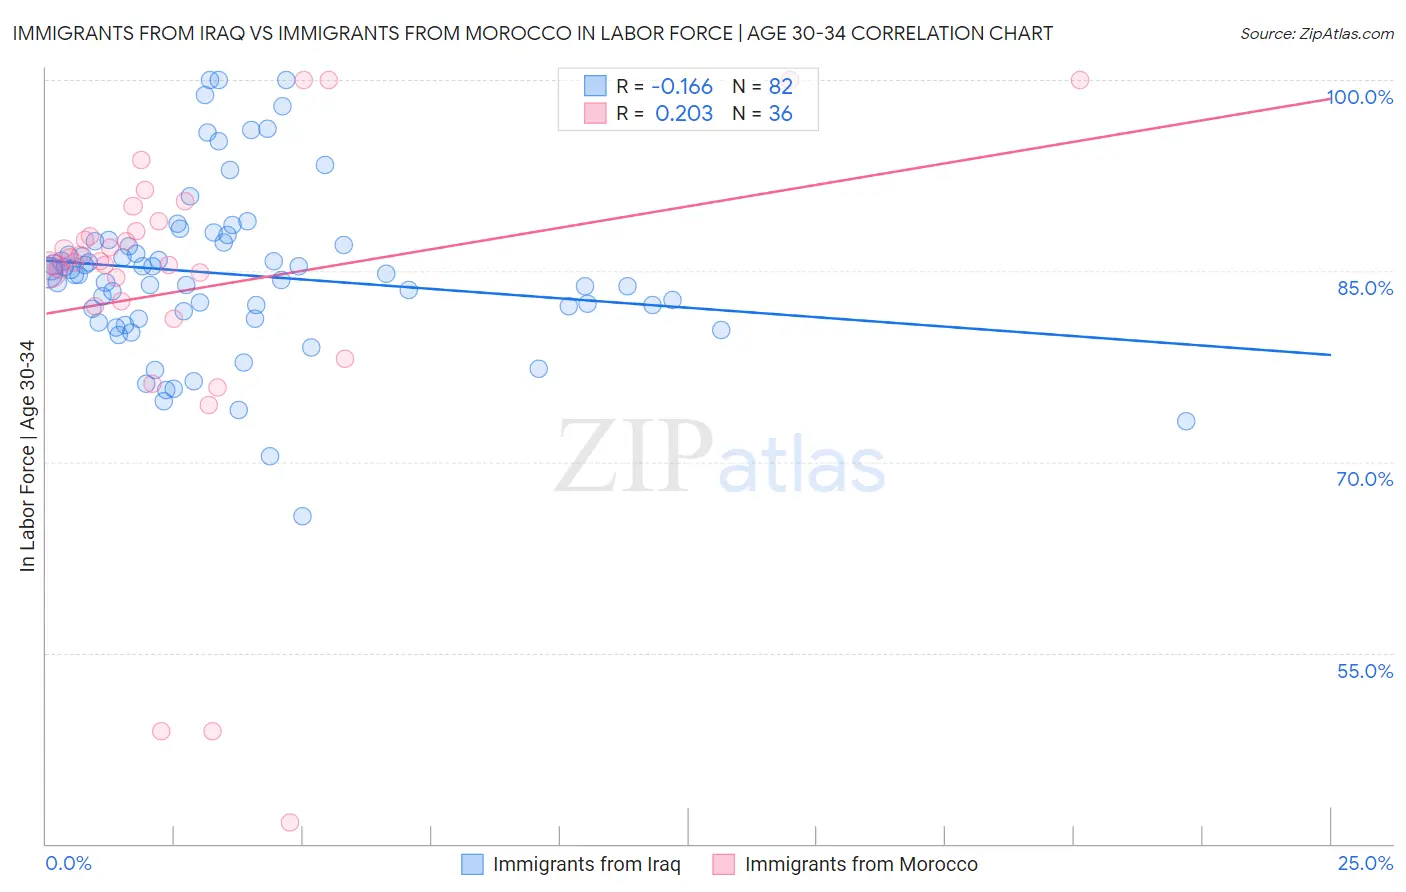
Immigrants from Iraq vs Immigrants from Morocco In Labor Force | Age 30-34 Correlation Chart
The statistical analysis conducted on geographies consisting of 194,759,411 people shows a poor negative correlation between the proportion of Immigrants from Iraq and labor force participation rate among population between the ages 30 and 34 in the United States with a correlation coefficient (R) of -0.166 and weighted average of 83.9%. Similarly, the statistical analysis conducted on geographies consisting of 178,904,869 people shows a weak positive correlation between the proportion of Immigrants from Morocco and labor force participation rate among population between the ages 30 and 34 in the United States with a correlation coefficient (R) of 0.203 and weighted average of 85.6%, a difference of 2.0%.
In Labor Force | Age 30-34 Correlation Summary
| Measurement | Immigrants from Iraq | Immigrants from Morocco |
| Minimum | 65.7% | 41.7% |
| Maximum | 100.0% | 100.0% |
| Range | 34.3% | 58.3% |
| Mean | 84.7% | 83.6% |
| Median | 84.8% | 85.7% |
| Interquartile 25% (IQ1) | 81.2% | 82.4% |
| Interquartile 75% (IQ3) | 87.3% | 88.5% |
| Interquartile Range (IQR) | 6.0% | 6.1% |
| Standard Deviation (Sample) | 6.6% | 13.0% |
| Standard Deviation (Population) | 6.5% | 12.8% |
Similar Demographics by In Labor Force | Age 30-34
Demographics Similar to Immigrants from Iraq by In Labor Force | Age 30-34
In terms of in labor force | age 30-34, the demographic groups most similar to Immigrants from Iraq are Portuguese (84.0%, a difference of 0.020%), Immigrants from Dominica (84.0%, a difference of 0.020%), Nicaraguan (83.9%, a difference of 0.020%), Bahamian (83.9%, a difference of 0.020%), and Immigrants from Nicaragua (83.9%, a difference of 0.020%).
| Demographics | Rating | Rank | In Labor Force | Age 30-34 |
| Immigrants | Caribbean | 1.1 /100 | #243 | Tragic 84.0% |
| Basques | 0.9 /100 | #244 | Tragic 84.0% |
| Immigrants | Venezuela | 0.9 /100 | #245 | Tragic 84.0% |
| Central Americans | 0.9 /100 | #246 | Tragic 84.0% |
| British West Indians | 0.8 /100 | #247 | Tragic 84.0% |
| Portuguese | 0.8 /100 | #248 | Tragic 84.0% |
| Immigrants | Dominica | 0.7 /100 | #249 | Tragic 84.0% |
| Immigrants | Iraq | 0.7 /100 | #250 | Tragic 83.9% |
| Nicaraguans | 0.6 /100 | #251 | Tragic 83.9% |
| Bahamians | 0.6 /100 | #252 | Tragic 83.9% |
| Immigrants | Nicaragua | 0.6 /100 | #253 | Tragic 83.9% |
| Immigrants | St. Vincent and the Grenadines | 0.5 /100 | #254 | Tragic 83.9% |
| Whites/Caucasians | 0.5 /100 | #255 | Tragic 83.9% |
| Immigrants | Lebanon | 0.4 /100 | #256 | Tragic 83.9% |
| Iraqis | 0.3 /100 | #257 | Tragic 83.8% |
Demographics Similar to Immigrants from Morocco by In Labor Force | Age 30-34
In terms of in labor force | age 30-34, the demographic groups most similar to Immigrants from Morocco are Croatian (85.6%, a difference of 0.0%), Immigrants from Sri Lanka (85.6%, a difference of 0.010%), Immigrants from Nepal (85.6%, a difference of 0.010%), Immigrants from Sweden (85.6%, a difference of 0.020%), and Lithuanian (85.6%, a difference of 0.020%).
| Demographics | Rating | Rank | In Labor Force | Age 30-34 |
| Eastern Europeans | 99.9 /100 | #39 | Exceptional 85.7% |
| Turks | 99.9 /100 | #40 | Exceptional 85.7% |
| Immigrants | Italy | 99.9 /100 | #41 | Exceptional 85.7% |
| Zimbabweans | 99.8 /100 | #42 | Exceptional 85.6% |
| Immigrants | Lithuania | 99.8 /100 | #43 | Exceptional 85.6% |
| Immigrants | Sri Lanka | 99.8 /100 | #44 | Exceptional 85.6% |
| Immigrants | Nepal | 99.8 /100 | #45 | Exceptional 85.6% |
| Immigrants | Morocco | 99.8 /100 | #46 | Exceptional 85.6% |
| Croatians | 99.8 /100 | #47 | Exceptional 85.6% |
| Immigrants | Sweden | 99.8 /100 | #48 | Exceptional 85.6% |
| Lithuanians | 99.8 /100 | #49 | Exceptional 85.6% |
| Immigrants | Australia | 99.8 /100 | #50 | Exceptional 85.6% |
| Cape Verdeans | 99.7 /100 | #51 | Exceptional 85.6% |
| Slovenes | 99.7 /100 | #52 | Exceptional 85.6% |
| Filipinos | 99.6 /100 | #53 | Exceptional 85.5% |