American vs Nepalese In Labor Force | Age 16-19
COMPARE
American
Nepalese
In Labor Force | Age 16-19
In Labor Force | Age 16-19 Comparison
Americans
Nepalese
40.3%
IN LABOR FORCE | AGE 16-19
100.0/ 100
METRIC RATING
61st/ 347
METRIC RANK
33.5%
IN LABOR FORCE | AGE 16-19
0.1/ 100
METRIC RATING
287th/ 347
METRIC RANK
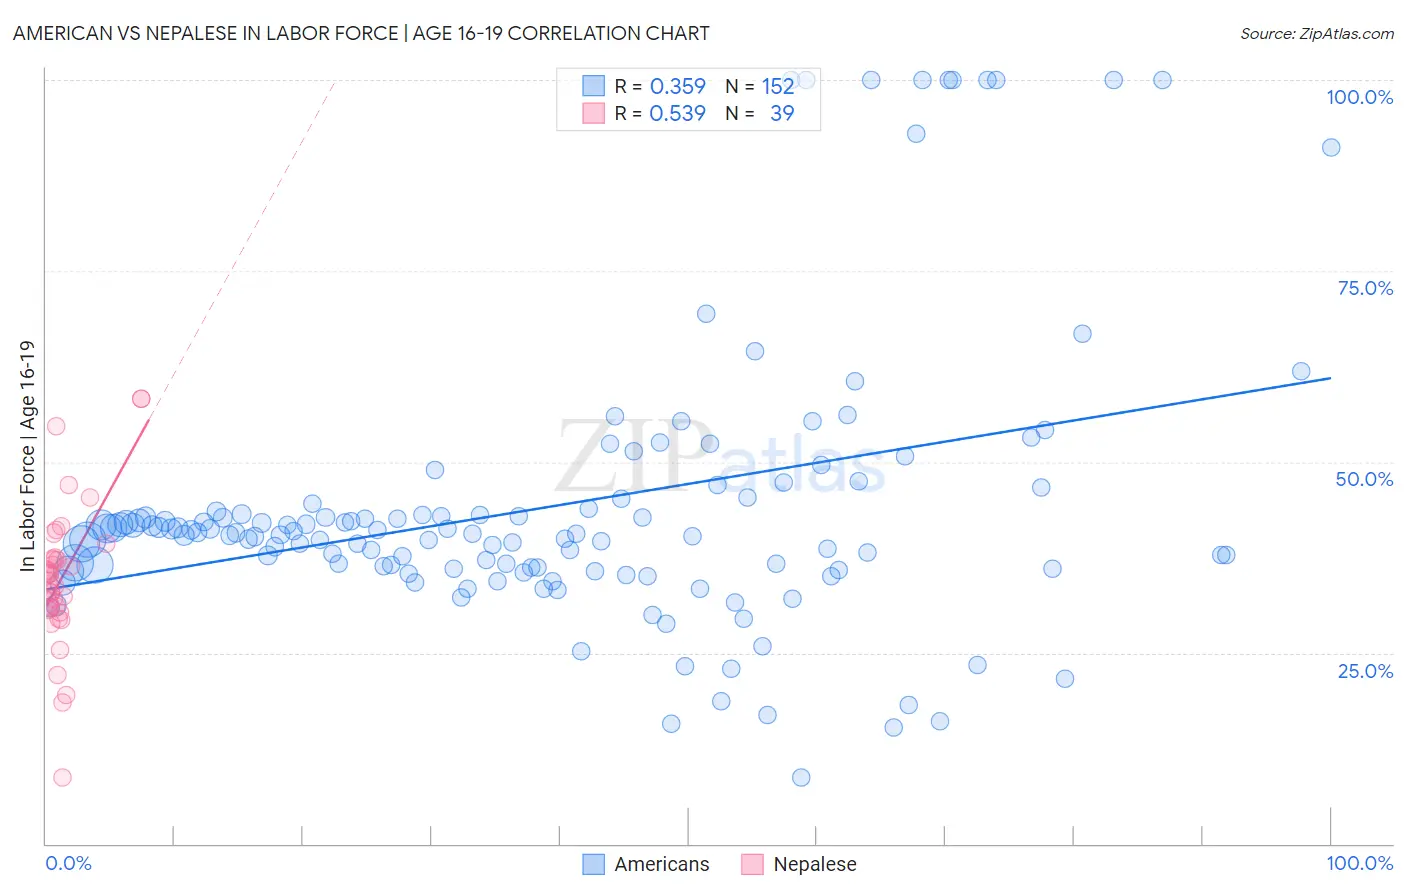
American vs Nepalese In Labor Force | Age 16-19 Correlation Chart
The statistical analysis conducted on geographies consisting of 576,408,281 people shows a mild positive correlation between the proportion of Americans and labor force participation rate among population between the ages 16 and 19 in the United States with a correlation coefficient (R) of 0.359 and weighted average of 40.3%. Similarly, the statistical analysis conducted on geographies consisting of 24,520,458 people shows a substantial positive correlation between the proportion of Nepalese and labor force participation rate among population between the ages 16 and 19 in the United States with a correlation coefficient (R) of 0.539 and weighted average of 33.5%, a difference of 20.3%.
In Labor Force | Age 16-19 Correlation Summary
| Measurement | American | Nepalese |
| Minimum | 8.6% | 8.7% |
| Maximum | 100.0% | 58.3% |
| Range | 91.4% | 49.6% |
| Mean | 44.1% | 34.9% |
| Median | 40.6% | 35.3% |
| Interquartile 25% (IQ1) | 36.0% | 30.6% |
| Interquartile 75% (IQ3) | 43.6% | 37.4% |
| Interquartile Range (IQR) | 7.6% | 6.8% |
| Standard Deviation (Sample) | 18.5% | 9.7% |
| Standard Deviation (Population) | 18.5% | 9.5% |
Similar Demographics by In Labor Force | Age 16-19
Demographics Similar to Americans by In Labor Force | Age 16-19
In terms of in labor force | age 16-19, the demographic groups most similar to Americans are Cherokee (40.2%, a difference of 0.14%), Immigrants from Eastern Africa (40.4%, a difference of 0.15%), Slavic (40.4%, a difference of 0.19%), Northern European (40.2%, a difference of 0.20%), and Immigrants from Micronesia (40.2%, a difference of 0.31%).
| Demographics | Rating | Rank | In Labor Force | Age 16-19 |
| Tlingit-Haida | 100.0 /100 | #54 | Exceptional 40.5% |
| British | 100.0 /100 | #55 | Exceptional 40.5% |
| Fijians | 100.0 /100 | #56 | Exceptional 40.4% |
| Lithuanians | 100.0 /100 | #57 | Exceptional 40.4% |
| Aleuts | 100.0 /100 | #58 | Exceptional 40.4% |
| Slavs | 100.0 /100 | #59 | Exceptional 40.4% |
| Immigrants | Eastern Africa | 100.0 /100 | #60 | Exceptional 40.4% |
| Americans | 100.0 /100 | #61 | Exceptional 40.3% |
| Cherokee | 100.0 /100 | #62 | Exceptional 40.2% |
| Northern Europeans | 100.0 /100 | #63 | Exceptional 40.2% |
| Immigrants | Micronesia | 100.0 /100 | #64 | Exceptional 40.2% |
| Kenyans | 100.0 /100 | #65 | Exceptional 40.1% |
| Immigrants | Nonimmigrants | 100.0 /100 | #66 | Exceptional 40.1% |
| Canadians | 100.0 /100 | #67 | Exceptional 40.1% |
| Italians | 99.9 /100 | #68 | Exceptional 40.1% |
Demographics Similar to Nepalese by In Labor Force | Age 16-19
In terms of in labor force | age 16-19, the demographic groups most similar to Nepalese are Immigrants from Indonesia (33.5%, a difference of 0.040%), Immigrants from Singapore (33.5%, a difference of 0.040%), Immigrants from Colombia (33.5%, a difference of 0.18%), South American (33.6%, a difference of 0.23%), and Immigrants from Belarus (33.4%, a difference of 0.25%).
| Demographics | Rating | Rank | In Labor Force | Age 16-19 |
| Taiwanese | 0.3 /100 | #280 | Tragic 33.8% |
| Cypriots | 0.3 /100 | #281 | Tragic 33.8% |
| Immigrants | Korea | 0.3 /100 | #282 | Tragic 33.8% |
| Immigrants | Venezuela | 0.2 /100 | #283 | Tragic 33.7% |
| Immigrants | Spain | 0.2 /100 | #284 | Tragic 33.7% |
| U.S. Virgin Islanders | 0.2 /100 | #285 | Tragic 33.6% |
| South Americans | 0.2 /100 | #286 | Tragic 33.6% |
| Nepalese | 0.1 /100 | #287 | Tragic 33.5% |
| Immigrants | Indonesia | 0.1 /100 | #288 | Tragic 33.5% |
| Immigrants | Singapore | 0.1 /100 | #289 | Tragic 33.5% |
| Immigrants | Colombia | 0.1 /100 | #290 | Tragic 33.5% |
| Immigrants | Belarus | 0.1 /100 | #291 | Tragic 33.4% |
| Haitians | 0.1 /100 | #292 | Tragic 33.4% |
| Immigrants | South America | 0.1 /100 | #293 | Tragic 33.3% |
| Argentineans | 0.1 /100 | #294 | Tragic 33.3% |