Immigrants from India vs Nepalese In Labor Force | Age 16-19
COMPARE
Immigrants from India
Nepalese
In Labor Force | Age 16-19
In Labor Force | Age 16-19 Comparison
Immigrants from India
Nepalese
35.0%
IN LABOR FORCE | AGE 16-19
3.5/ 100
METRIC RATING
237th/ 347
METRIC RANK
33.5%
IN LABOR FORCE | AGE 16-19
0.1/ 100
METRIC RATING
287th/ 347
METRIC RANK
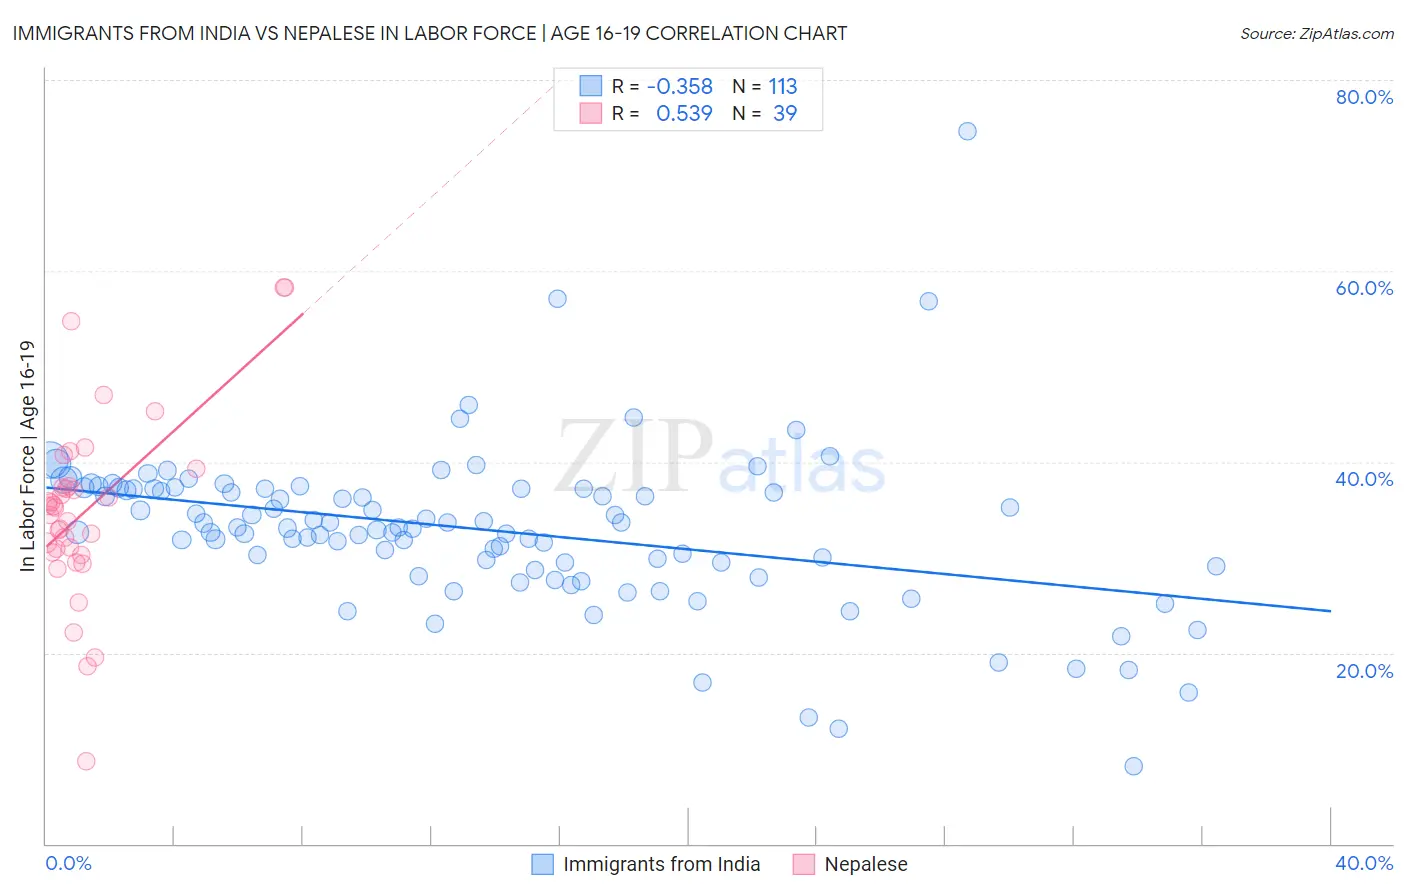
Immigrants from India vs Nepalese In Labor Force | Age 16-19 Correlation Chart
The statistical analysis conducted on geographies consisting of 433,366,164 people shows a mild negative correlation between the proportion of Immigrants from India and labor force participation rate among population between the ages 16 and 19 in the United States with a correlation coefficient (R) of -0.358 and weighted average of 35.0%. Similarly, the statistical analysis conducted on geographies consisting of 24,520,458 people shows a substantial positive correlation between the proportion of Nepalese and labor force participation rate among population between the ages 16 and 19 in the United States with a correlation coefficient (R) of 0.539 and weighted average of 33.5%, a difference of 4.6%.
In Labor Force | Age 16-19 Correlation Summary
| Measurement | Immigrants from India | Nepalese |
| Minimum | 8.1% | 8.7% |
| Maximum | 74.6% | 58.3% |
| Range | 66.5% | 49.6% |
| Mean | 32.9% | 34.9% |
| Median | 33.1% | 35.3% |
| Interquartile 25% (IQ1) | 29.2% | 30.6% |
| Interquartile 75% (IQ3) | 37.2% | 37.4% |
| Interquartile Range (IQR) | 8.0% | 6.8% |
| Standard Deviation (Sample) | 8.5% | 9.7% |
| Standard Deviation (Population) | 8.5% | 9.5% |
Similar Demographics by In Labor Force | Age 16-19
Demographics Similar to Immigrants from India by In Labor Force | Age 16-19
In terms of in labor force | age 16-19, the demographic groups most similar to Immigrants from India are Immigrants from Australia (35.1%, a difference of 0.030%), Immigrants from Vietnam (35.0%, a difference of 0.050%), Inupiat (35.0%, a difference of 0.14%), Immigrants from Philippines (35.1%, a difference of 0.17%), and Immigrants from Central America (35.0%, a difference of 0.23%).
| Demographics | Rating | Rank | In Labor Force | Age 16-19 |
| Immigrants | Honduras | 4.9 /100 | #230 | Tragic 35.2% |
| Immigrants | Syria | 4.5 /100 | #231 | Tragic 35.2% |
| Immigrants | Kazakhstan | 4.5 /100 | #232 | Tragic 35.2% |
| Immigrants | France | 4.3 /100 | #233 | Tragic 35.1% |
| Immigrants | Mexico | 4.2 /100 | #234 | Tragic 35.1% |
| Immigrants | Philippines | 4.0 /100 | #235 | Tragic 35.1% |
| Immigrants | Australia | 3.6 /100 | #236 | Tragic 35.1% |
| Immigrants | India | 3.5 /100 | #237 | Tragic 35.0% |
| Immigrants | Vietnam | 3.4 /100 | #238 | Tragic 35.0% |
| Inupiat | 3.2 /100 | #239 | Tragic 35.0% |
| Immigrants | Central America | 3.0 /100 | #240 | Tragic 35.0% |
| Immigrants | Ireland | 2.9 /100 | #241 | Tragic 35.0% |
| Uruguayans | 2.6 /100 | #242 | Tragic 34.9% |
| Pueblo | 2.6 /100 | #243 | Tragic 34.9% |
| Immigrants | Turkey | 2.6 /100 | #244 | Tragic 34.9% |
Demographics Similar to Nepalese by In Labor Force | Age 16-19
In terms of in labor force | age 16-19, the demographic groups most similar to Nepalese are Immigrants from Indonesia (33.5%, a difference of 0.040%), Immigrants from Singapore (33.5%, a difference of 0.040%), Immigrants from Colombia (33.5%, a difference of 0.18%), South American (33.6%, a difference of 0.23%), and Immigrants from Belarus (33.4%, a difference of 0.25%).
| Demographics | Rating | Rank | In Labor Force | Age 16-19 |
| Taiwanese | 0.3 /100 | #280 | Tragic 33.8% |
| Cypriots | 0.3 /100 | #281 | Tragic 33.8% |
| Immigrants | Korea | 0.3 /100 | #282 | Tragic 33.8% |
| Immigrants | Venezuela | 0.2 /100 | #283 | Tragic 33.7% |
| Immigrants | Spain | 0.2 /100 | #284 | Tragic 33.7% |
| U.S. Virgin Islanders | 0.2 /100 | #285 | Tragic 33.6% |
| South Americans | 0.2 /100 | #286 | Tragic 33.6% |
| Nepalese | 0.1 /100 | #287 | Tragic 33.5% |
| Immigrants | Indonesia | 0.1 /100 | #288 | Tragic 33.5% |
| Immigrants | Singapore | 0.1 /100 | #289 | Tragic 33.5% |
| Immigrants | Colombia | 0.1 /100 | #290 | Tragic 33.5% |
| Immigrants | Belarus | 0.1 /100 | #291 | Tragic 33.4% |
| Haitians | 0.1 /100 | #292 | Tragic 33.4% |
| Immigrants | South America | 0.1 /100 | #293 | Tragic 33.3% |
| Argentineans | 0.1 /100 | #294 | Tragic 33.3% |