Immigrants from Honduras vs German In Labor Force | Age 25-29
COMPARE
Immigrants from Honduras
German
In Labor Force | Age 25-29
In Labor Force | Age 25-29 Comparison
Immigrants from Honduras
Germans
83.3%
IN LABOR FORCE | AGE 25-29
0.0/ 100
METRIC RATING
276th/ 347
METRIC RANK
85.3%
IN LABOR FORCE | AGE 25-29
98.1/ 100
METRIC RATING
76th/ 347
METRIC RANK
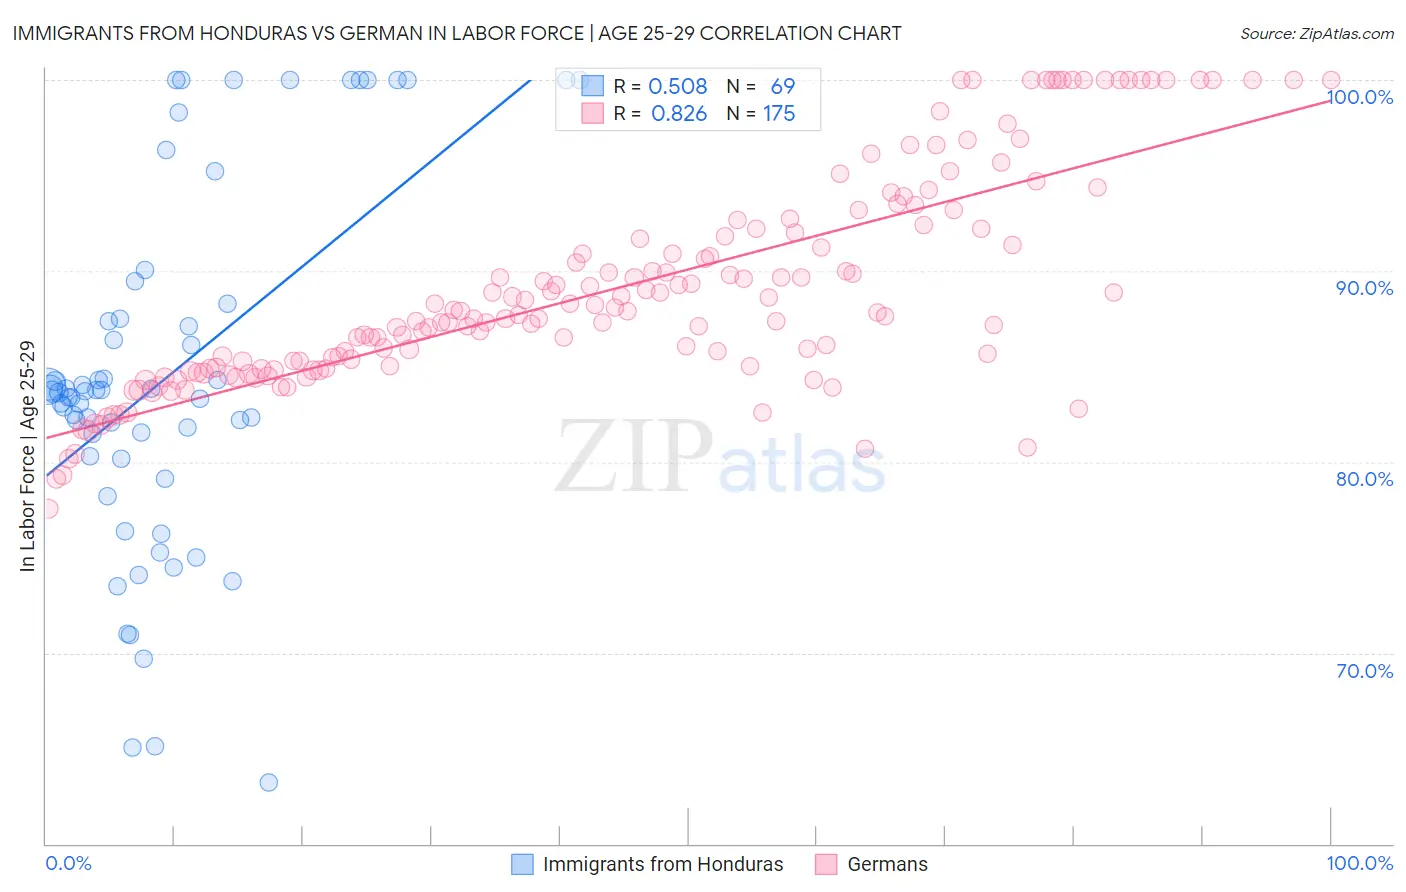
Immigrants from Honduras vs German In Labor Force | Age 25-29 Correlation Chart
The statistical analysis conducted on geographies consisting of 322,539,731 people shows a substantial positive correlation between the proportion of Immigrants from Honduras and labor force participation rate among population between the ages 25 and 29 in the United States with a correlation coefficient (R) of 0.508 and weighted average of 83.3%. Similarly, the statistical analysis conducted on geographies consisting of 579,041,813 people shows a very strong positive correlation between the proportion of Germans and labor force participation rate among population between the ages 25 and 29 in the United States with a correlation coefficient (R) of 0.826 and weighted average of 85.3%, a difference of 2.4%.
In Labor Force | Age 25-29 Correlation Summary
| Measurement | Immigrants from Honduras | German |
| Minimum | 63.2% | 77.6% |
| Maximum | 100.0% | 100.0% |
| Range | 36.8% | 22.4% |
| Mean | 84.4% | 89.0% |
| Median | 83.7% | 87.7% |
| Interquartile 25% (IQ1) | 80.2% | 84.9% |
| Interquartile 75% (IQ3) | 87.9% | 92.2% |
| Interquartile Range (IQR) | 7.7% | 7.3% |
| Standard Deviation (Sample) | 9.3% | 5.5% |
| Standard Deviation (Population) | 9.3% | 5.5% |
Similar Demographics by In Labor Force | Age 25-29
Demographics Similar to Immigrants from Honduras by In Labor Force | Age 25-29
In terms of in labor force | age 25-29, the demographic groups most similar to Immigrants from Honduras are Samoan (83.3%, a difference of 0.0%), Marshallese (83.3%, a difference of 0.050%), Immigrants from Dominica (83.4%, a difference of 0.070%), African (83.2%, a difference of 0.070%), and Immigrants from Caribbean (83.4%, a difference of 0.080%).
| Demographics | Rating | Rank | In Labor Force | Age 25-29 |
| Immigrants | Barbados | 0.0 /100 | #269 | Tragic 83.4% |
| Basques | 0.0 /100 | #270 | Tragic 83.4% |
| Hondurans | 0.0 /100 | #271 | Tragic 83.4% |
| Immigrants | Caribbean | 0.0 /100 | #272 | Tragic 83.4% |
| Immigrants | Dominica | 0.0 /100 | #273 | Tragic 83.4% |
| Marshallese | 0.0 /100 | #274 | Tragic 83.3% |
| Samoans | 0.0 /100 | #275 | Tragic 83.3% |
| Immigrants | Honduras | 0.0 /100 | #276 | Tragic 83.3% |
| Africans | 0.0 /100 | #277 | Tragic 83.2% |
| Immigrants | Cuba | 0.0 /100 | #278 | Tragic 83.2% |
| British West Indians | 0.0 /100 | #279 | Tragic 83.2% |
| Dominicans | 0.0 /100 | #280 | Tragic 83.2% |
| Immigrants | Dominican Republic | 0.0 /100 | #281 | Tragic 83.1% |
| Americans | 0.0 /100 | #282 | Tragic 83.1% |
| Immigrants | Azores | 0.0 /100 | #283 | Tragic 83.1% |
Demographics Similar to Germans by In Labor Force | Age 25-29
In terms of in labor force | age 25-29, the demographic groups most similar to Germans are Brazilian (85.3%, a difference of 0.020%), Immigrants from South Central Asia (85.2%, a difference of 0.020%), Immigrants from Egypt (85.2%, a difference of 0.030%), Immigrants from Northern Africa (85.2%, a difference of 0.040%), and Immigrants from Zimbabwe (85.2%, a difference of 0.040%).
| Demographics | Rating | Rank | In Labor Force | Age 25-29 |
| Menominee | 99.1 /100 | #69 | Exceptional 85.4% |
| Immigrants | Sweden | 99.1 /100 | #70 | Exceptional 85.4% |
| Kenyans | 99.0 /100 | #71 | Exceptional 85.4% |
| Immigrants | Australia | 98.9 /100 | #72 | Exceptional 85.3% |
| Russians | 98.8 /100 | #73 | Exceptional 85.3% |
| Soviet Union | 98.5 /100 | #74 | Exceptional 85.3% |
| Brazilians | 98.3 /100 | #75 | Exceptional 85.3% |
| Germans | 98.1 /100 | #76 | Exceptional 85.3% |
| Immigrants | South Central Asia | 97.9 /100 | #77 | Exceptional 85.2% |
| Immigrants | Egypt | 97.7 /100 | #78 | Exceptional 85.2% |
| Immigrants | Northern Africa | 97.6 /100 | #79 | Exceptional 85.2% |
| Immigrants | Zimbabwe | 97.6 /100 | #80 | Exceptional 85.2% |
| Immigrants | Northern Europe | 97.2 /100 | #81 | Exceptional 85.2% |
| Okinawans | 97.0 /100 | #82 | Exceptional 85.2% |
| Immigrants | Europe | 96.8 /100 | #83 | Exceptional 85.2% |