Immigrants from Guyana vs Tongan In Labor Force | Age 20-64
COMPARE
Immigrants from Guyana
Tongan
In Labor Force | Age 20-64
In Labor Force | Age 20-64 Comparison
Immigrants from Guyana
Tongans
78.1%
IN LABOR FORCE | AGE 20-64
0.0/ 100
METRIC RATING
284th/ 347
METRIC RANK
80.3%
IN LABOR FORCE | AGE 20-64
98.8/ 100
METRIC RATING
60th/ 347
METRIC RANK
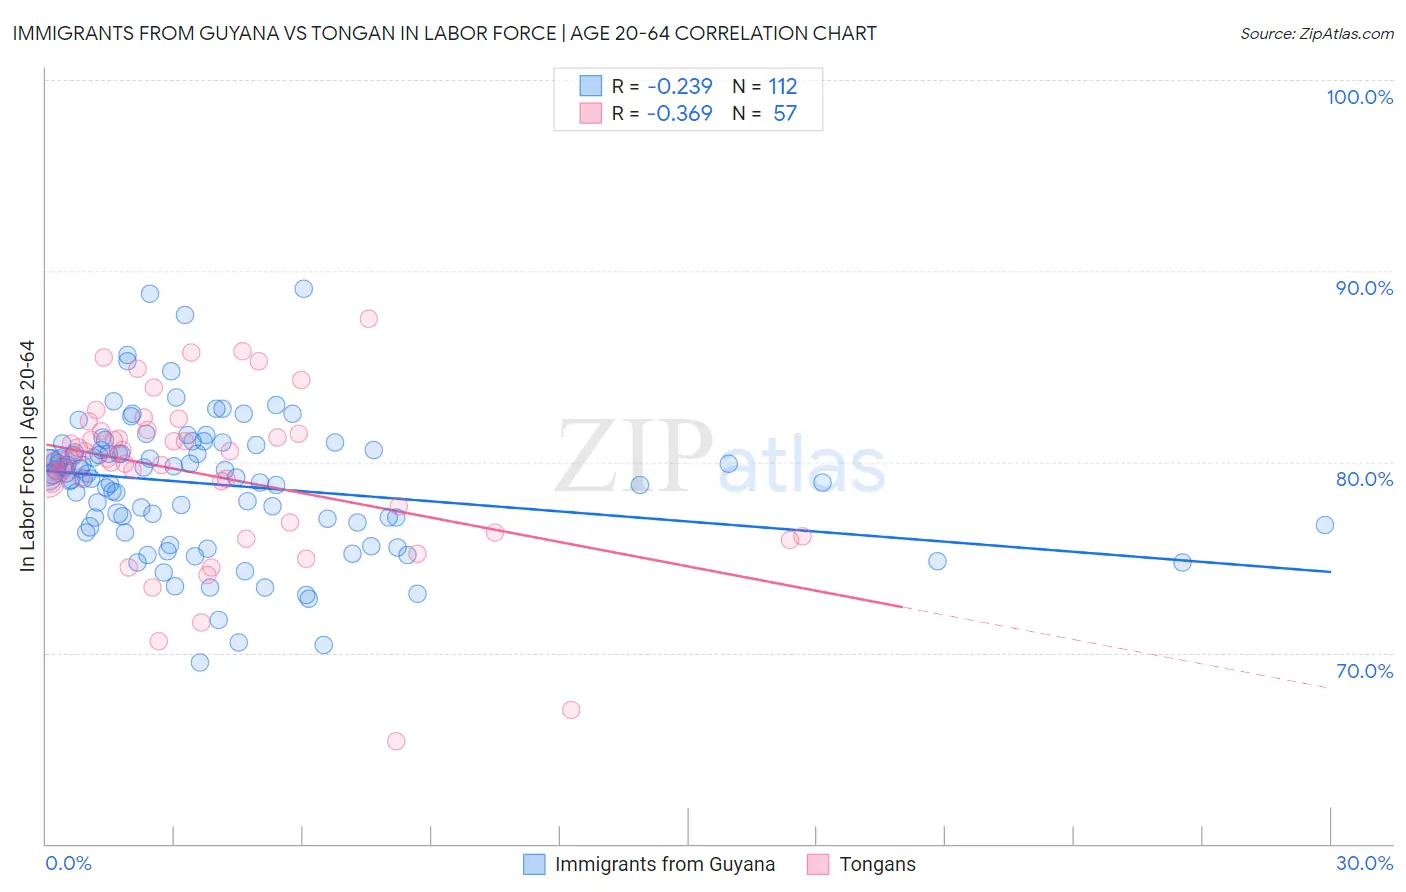
Immigrants from Guyana vs Tongan In Labor Force | Age 20-64 Correlation Chart
The statistical analysis conducted on geographies consisting of 183,664,585 people shows a weak negative correlation between the proportion of Immigrants from Guyana and labor force participation rate among population between the ages 20 and 64 in the United States with a correlation coefficient (R) of -0.239 and weighted average of 78.1%. Similarly, the statistical analysis conducted on geographies consisting of 102,905,644 people shows a mild negative correlation between the proportion of Tongans and labor force participation rate among population between the ages 20 and 64 in the United States with a correlation coefficient (R) of -0.369 and weighted average of 80.3%, a difference of 2.8%.
In Labor Force | Age 20-64 Correlation Summary
| Measurement | Immigrants from Guyana | Tongan |
| Minimum | 69.5% | 65.4% |
| Maximum | 89.1% | 87.5% |
| Range | 19.6% | 22.1% |
| Mean | 78.8% | 79.3% |
| Median | 79.3% | 80.0% |
| Interquartile 25% (IQ1) | 76.7% | 76.5% |
| Interquartile 75% (IQ3) | 80.6% | 81.6% |
| Interquartile Range (IQR) | 3.9% | 5.0% |
| Standard Deviation (Sample) | 3.5% | 4.4% |
| Standard Deviation (Population) | 3.5% | 4.3% |
Similar Demographics by In Labor Force | Age 20-64
Demographics Similar to Immigrants from Guyana by In Labor Force | Age 20-64
In terms of in labor force | age 20-64, the demographic groups most similar to Immigrants from Guyana are Nonimmigrants (78.1%, a difference of 0.010%), Immigrants from St. Vincent and the Grenadines (78.1%, a difference of 0.030%), Guyanese (78.1%, a difference of 0.050%), Immigrants from Dominica (78.1%, a difference of 0.080%), and Osage (78.0%, a difference of 0.10%).
| Demographics | Rating | Rank | In Labor Force | Age 20-64 |
| Immigrants | Bahamas | 0.0 /100 | #277 | Tragic 78.2% |
| Mexican American Indians | 0.0 /100 | #278 | Tragic 78.2% |
| Belizeans | 0.0 /100 | #279 | Tragic 78.2% |
| Immigrants | Dominica | 0.0 /100 | #280 | Tragic 78.1% |
| Guyanese | 0.0 /100 | #281 | Tragic 78.1% |
| Immigrants | St. Vincent and the Grenadines | 0.0 /100 | #282 | Tragic 78.1% |
| Immigrants | Nonimmigrants | 0.0 /100 | #283 | Tragic 78.1% |
| Immigrants | Guyana | 0.0 /100 | #284 | Tragic 78.1% |
| Osage | 0.0 /100 | #285 | Tragic 78.0% |
| Immigrants | Belize | 0.0 /100 | #286 | Tragic 78.0% |
| Vietnamese | 0.0 /100 | #287 | Tragic 78.0% |
| Hmong | 0.0 /100 | #288 | Tragic 77.9% |
| Africans | 0.0 /100 | #289 | Tragic 77.9% |
| Immigrants | Bangladesh | 0.0 /100 | #290 | Tragic 77.9% |
| Spanish Americans | 0.0 /100 | #291 | Tragic 77.8% |
Demographics Similar to Tongans by In Labor Force | Age 20-64
In terms of in labor force | age 20-64, the demographic groups most similar to Tongans are Swedish (80.3%, a difference of 0.0%), Burmese (80.3%, a difference of 0.0%), Carpatho Rusyn (80.3%, a difference of 0.0%), Serbian (80.3%, a difference of 0.010%), and Immigrants from Korea (80.3%, a difference of 0.010%).
| Demographics | Rating | Rank | In Labor Force | Age 20-64 |
| Immigrants | Peru | 99.2 /100 | #53 | Exceptional 80.3% |
| Peruvians | 99.1 /100 | #54 | Exceptional 80.3% |
| Immigrants | Cabo Verde | 99.0 /100 | #55 | Exceptional 80.3% |
| Immigrants | Northern Africa | 99.0 /100 | #56 | Exceptional 80.3% |
| Afghans | 98.9 /100 | #57 | Exceptional 80.3% |
| Serbians | 98.9 /100 | #58 | Exceptional 80.3% |
| Swedes | 98.9 /100 | #59 | Exceptional 80.3% |
| Tongans | 98.8 /100 | #60 | Exceptional 80.3% |
| Burmese | 98.8 /100 | #61 | Exceptional 80.3% |
| Carpatho Rusyns | 98.8 /100 | #62 | Exceptional 80.3% |
| Immigrants | Korea | 98.8 /100 | #63 | Exceptional 80.3% |
| Immigrants | Albania | 98.7 /100 | #64 | Exceptional 80.3% |
| Lithuanians | 98.7 /100 | #65 | Exceptional 80.2% |
| Macedonians | 98.7 /100 | #66 | Exceptional 80.2% |
| Taiwanese | 98.6 /100 | #67 | Exceptional 80.2% |