Immigrants from Guyana vs Immigrants from Central America In Labor Force | Age 20-64
COMPARE
Immigrants from Guyana
Immigrants from Central America
In Labor Force | Age 20-64
In Labor Force | Age 20-64 Comparison
Immigrants from Guyana
Immigrants from Central America
78.1%
IN LABOR FORCE | AGE 20-64
0.0/ 100
METRIC RATING
284th/ 347
METRIC RANK
77.7%
IN LABOR FORCE | AGE 20-64
0.0/ 100
METRIC RATING
294th/ 347
METRIC RANK
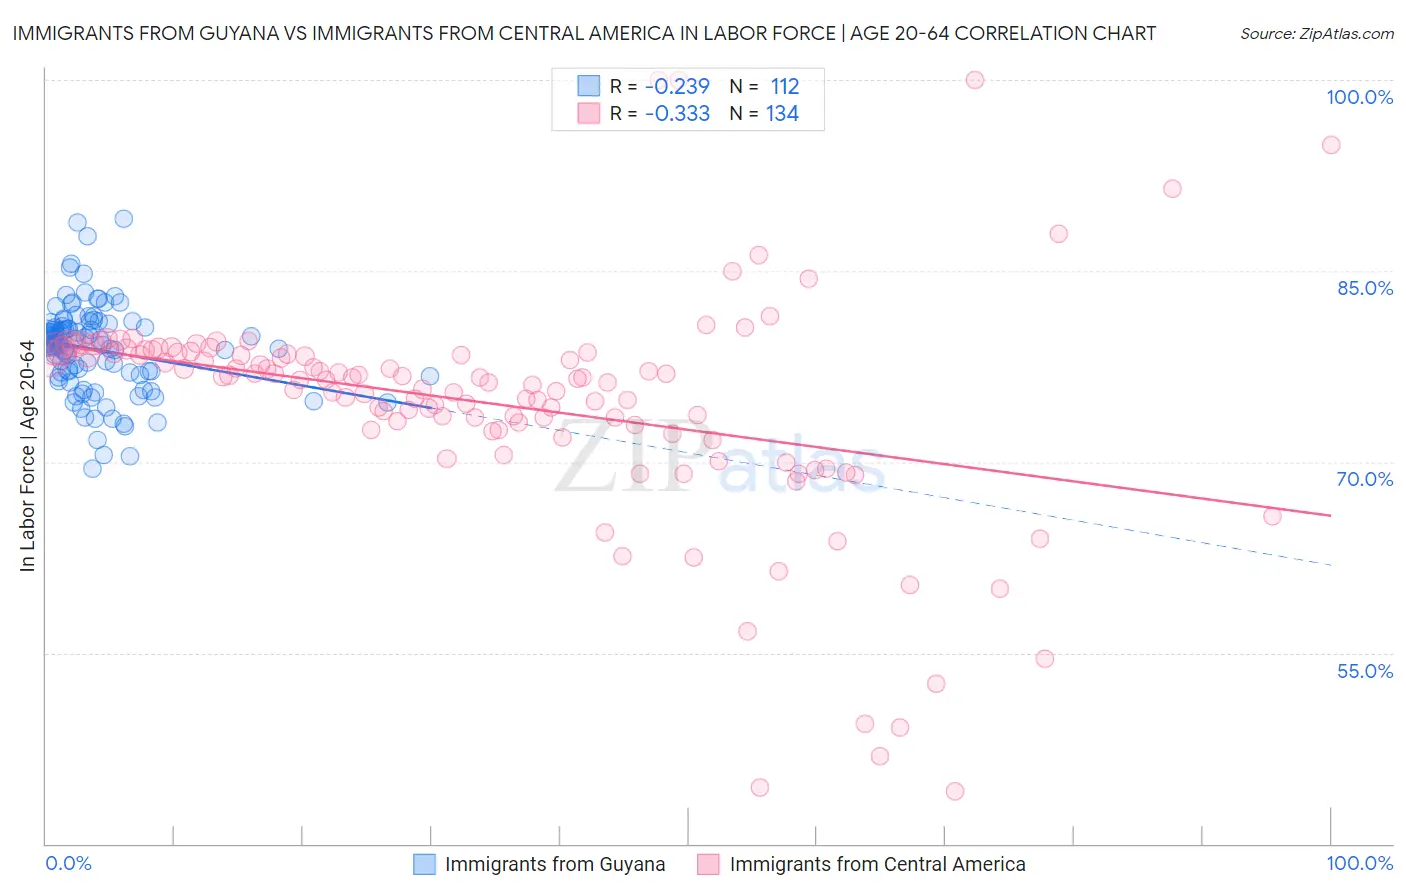
Immigrants from Guyana vs Immigrants from Central America In Labor Force | Age 20-64 Correlation Chart
The statistical analysis conducted on geographies consisting of 183,664,585 people shows a weak negative correlation between the proportion of Immigrants from Guyana and labor force participation rate among population between the ages 20 and 64 in the United States with a correlation coefficient (R) of -0.239 and weighted average of 78.1%. Similarly, the statistical analysis conducted on geographies consisting of 536,506,208 people shows a mild negative correlation between the proportion of Immigrants from Central America and labor force participation rate among population between the ages 20 and 64 in the United States with a correlation coefficient (R) of -0.333 and weighted average of 77.7%, a difference of 0.44%.
In Labor Force | Age 20-64 Correlation Summary
| Measurement | Immigrants from Guyana | Immigrants from Central America |
| Minimum | 69.5% | 44.1% |
| Maximum | 89.1% | 100.0% |
| Range | 19.6% | 55.9% |
| Mean | 78.8% | 74.5% |
| Median | 79.3% | 76.5% |
| Interquartile 25% (IQ1) | 76.7% | 72.5% |
| Interquartile 75% (IQ3) | 80.6% | 78.6% |
| Interquartile Range (IQR) | 3.9% | 6.1% |
| Standard Deviation (Sample) | 3.5% | 9.0% |
| Standard Deviation (Population) | 3.5% | 9.0% |
Demographics Similar to Immigrants from Guyana and Immigrants from Central America by In Labor Force | Age 20-64
In terms of in labor force | age 20-64, the demographic groups most similar to Immigrants from Guyana are Nonimmigrants (78.1%, a difference of 0.010%), Immigrants from St. Vincent and the Grenadines (78.1%, a difference of 0.030%), Guyanese (78.1%, a difference of 0.050%), Immigrants from Dominica (78.1%, a difference of 0.080%), and Osage (78.0%, a difference of 0.10%). Similarly, the demographic groups most similar to Immigrants from Central America are Immigrants from Grenada (77.7%, a difference of 0.030%), Immigrants from Dominican Republic (77.7%, a difference of 0.070%), Dominican (77.7%, a difference of 0.070%), Cree (77.7%, a difference of 0.080%), and Delaware (77.8%, a difference of 0.090%).
| Demographics | Rating | Rank | In Labor Force | Age 20-64 |
| Belizeans | 0.0 /100 | #279 | Tragic 78.2% |
| Immigrants | Dominica | 0.0 /100 | #280 | Tragic 78.1% |
| Guyanese | 0.0 /100 | #281 | Tragic 78.1% |
| Immigrants | St. Vincent and the Grenadines | 0.0 /100 | #282 | Tragic 78.1% |
| Immigrants | Nonimmigrants | 0.0 /100 | #283 | Tragic 78.1% |
| Immigrants | Guyana | 0.0 /100 | #284 | Tragic 78.1% |
| Osage | 0.0 /100 | #285 | Tragic 78.0% |
| Immigrants | Belize | 0.0 /100 | #286 | Tragic 78.0% |
| Vietnamese | 0.0 /100 | #287 | Tragic 78.0% |
| Hmong | 0.0 /100 | #288 | Tragic 77.9% |
| Africans | 0.0 /100 | #289 | Tragic 77.9% |
| Immigrants | Bangladesh | 0.0 /100 | #290 | Tragic 77.9% |
| Spanish Americans | 0.0 /100 | #291 | Tragic 77.8% |
| Immigrants | Azores | 0.0 /100 | #292 | Tragic 77.8% |
| Delaware | 0.0 /100 | #293 | Tragic 77.8% |
| Immigrants | Central America | 0.0 /100 | #294 | Tragic 77.7% |
| Immigrants | Grenada | 0.0 /100 | #295 | Tragic 77.7% |
| Immigrants | Dominican Republic | 0.0 /100 | #296 | Tragic 77.7% |
| Dominicans | 0.0 /100 | #297 | Tragic 77.7% |
| Cree | 0.0 /100 | #298 | Tragic 77.7% |
| Hispanics or Latinos | 0.0 /100 | #299 | Tragic 77.6% |