Immigrants from Guyana vs Immigrants from Northern Europe In Labor Force | Age 20-64
COMPARE
Immigrants from Guyana
Immigrants from Northern Europe
In Labor Force | Age 20-64
In Labor Force | Age 20-64 Comparison
Immigrants from Guyana
Immigrants from Northern Europe
78.1%
IN LABOR FORCE | AGE 20-64
0.0/ 100
METRIC RATING
284th/ 347
METRIC RANK
79.7%
IN LABOR FORCE | AGE 20-64
72.0/ 100
METRIC RATING
152nd/ 347
METRIC RANK
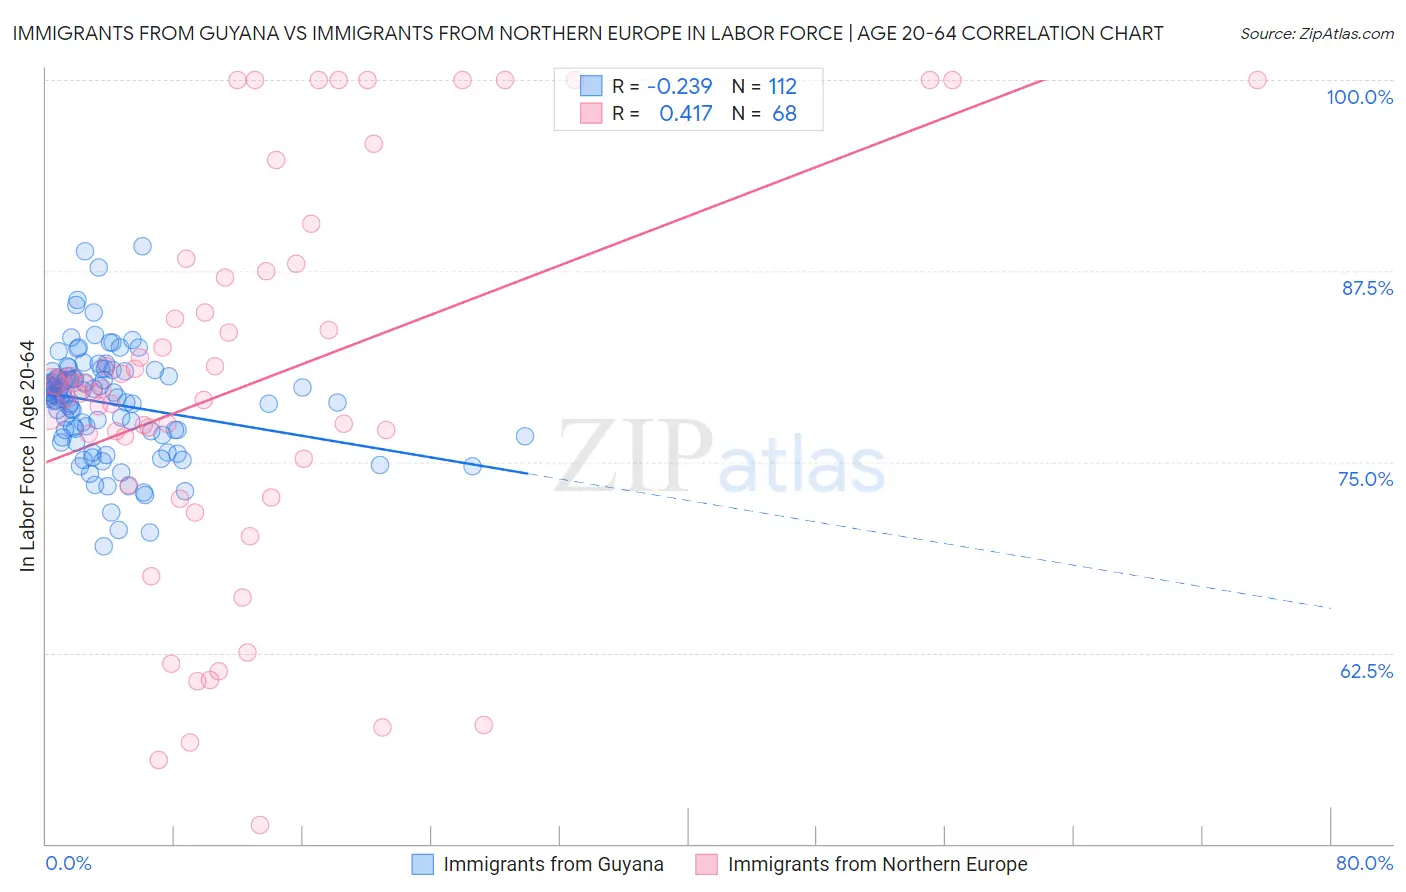
Immigrants from Guyana vs Immigrants from Northern Europe In Labor Force | Age 20-64 Correlation Chart
The statistical analysis conducted on geographies consisting of 183,664,585 people shows a weak negative correlation between the proportion of Immigrants from Guyana and labor force participation rate among population between the ages 20 and 64 in the United States with a correlation coefficient (R) of -0.239 and weighted average of 78.1%. Similarly, the statistical analysis conducted on geographies consisting of 477,244,131 people shows a moderate positive correlation between the proportion of Immigrants from Northern Europe and labor force participation rate among population between the ages 20 and 64 in the United States with a correlation coefficient (R) of 0.417 and weighted average of 79.7%, a difference of 2.1%.
In Labor Force | Age 20-64 Correlation Summary
| Measurement | Immigrants from Guyana | Immigrants from Northern Europe |
| Minimum | 69.5% | 51.2% |
| Maximum | 89.1% | 100.0% |
| Range | 19.6% | 48.8% |
| Mean | 78.8% | 80.1% |
| Median | 79.3% | 79.9% |
| Interquartile 25% (IQ1) | 76.7% | 74.4% |
| Interquartile 75% (IQ3) | 80.6% | 87.3% |
| Interquartile Range (IQR) | 3.9% | 12.9% |
| Standard Deviation (Sample) | 3.5% | 12.7% |
| Standard Deviation (Population) | 3.5% | 12.6% |
Similar Demographics by In Labor Force | Age 20-64
Demographics Similar to Immigrants from Guyana by In Labor Force | Age 20-64
In terms of in labor force | age 20-64, the demographic groups most similar to Immigrants from Guyana are Nonimmigrants (78.1%, a difference of 0.010%), Immigrants from St. Vincent and the Grenadines (78.1%, a difference of 0.030%), Guyanese (78.1%, a difference of 0.050%), Immigrants from Dominica (78.1%, a difference of 0.080%), and Osage (78.0%, a difference of 0.10%).
| Demographics | Rating | Rank | In Labor Force | Age 20-64 |
| Immigrants | Bahamas | 0.0 /100 | #277 | Tragic 78.2% |
| Mexican American Indians | 0.0 /100 | #278 | Tragic 78.2% |
| Belizeans | 0.0 /100 | #279 | Tragic 78.2% |
| Immigrants | Dominica | 0.0 /100 | #280 | Tragic 78.1% |
| Guyanese | 0.0 /100 | #281 | Tragic 78.1% |
| Immigrants | St. Vincent and the Grenadines | 0.0 /100 | #282 | Tragic 78.1% |
| Immigrants | Nonimmigrants | 0.0 /100 | #283 | Tragic 78.1% |
| Immigrants | Guyana | 0.0 /100 | #284 | Tragic 78.1% |
| Osage | 0.0 /100 | #285 | Tragic 78.0% |
| Immigrants | Belize | 0.0 /100 | #286 | Tragic 78.0% |
| Vietnamese | 0.0 /100 | #287 | Tragic 78.0% |
| Hmong | 0.0 /100 | #288 | Tragic 77.9% |
| Africans | 0.0 /100 | #289 | Tragic 77.9% |
| Immigrants | Bangladesh | 0.0 /100 | #290 | Tragic 77.9% |
| Spanish Americans | 0.0 /100 | #291 | Tragic 77.8% |
Demographics Similar to Immigrants from Northern Europe by In Labor Force | Age 20-64
In terms of in labor force | age 20-64, the demographic groups most similar to Immigrants from Northern Europe are Costa Rican (79.7%, a difference of 0.0%), Scandinavian (79.7%, a difference of 0.0%), Immigrants from Kazakhstan (79.7%, a difference of 0.020%), New Zealander (79.7%, a difference of 0.020%), and Icelander (79.7%, a difference of 0.030%).
| Demographics | Rating | Rank | In Labor Force | Age 20-64 |
| Pakistanis | 79.3 /100 | #145 | Good 79.8% |
| Immigrants | Southern Europe | 78.9 /100 | #146 | Good 79.8% |
| Immigrants | Philippines | 78.0 /100 | #147 | Good 79.8% |
| Romanians | 77.6 /100 | #148 | Good 79.8% |
| Icelanders | 75.1 /100 | #149 | Good 79.7% |
| Costa Ricans | 72.4 /100 | #150 | Good 79.7% |
| Scandinavians | 72.0 /100 | #151 | Good 79.7% |
| Immigrants | Northern Europe | 72.0 /100 | #152 | Good 79.7% |
| Immigrants | Kazakhstan | 69.5 /100 | #153 | Good 79.7% |
| New Zealanders | 69.4 /100 | #154 | Good 79.7% |
| Immigrants | South Africa | 69.2 /100 | #155 | Good 79.7% |
| Senegalese | 69.1 /100 | #156 | Good 79.7% |
| Immigrants | China | 69.1 /100 | #157 | Good 79.7% |
| Austrians | 67.6 /100 | #158 | Good 79.7% |
| Immigrants | Cuba | 66.7 /100 | #159 | Good 79.7% |