Immigrants from Guyana vs Kenyan Average Family Size
COMPARE
Immigrants from Guyana
Kenyan
Average Family Size
Average Family Size Comparison
Immigrants from Guyana
Kenyans
3.40
AVERAGE FAMILY SIZE
100.0/ 100
METRIC RATING
36th/ 347
METRIC RANK
3.21
AVERAGE FAMILY SIZE
28.0/ 100
METRIC RATING
197th/ 347
METRIC RANK
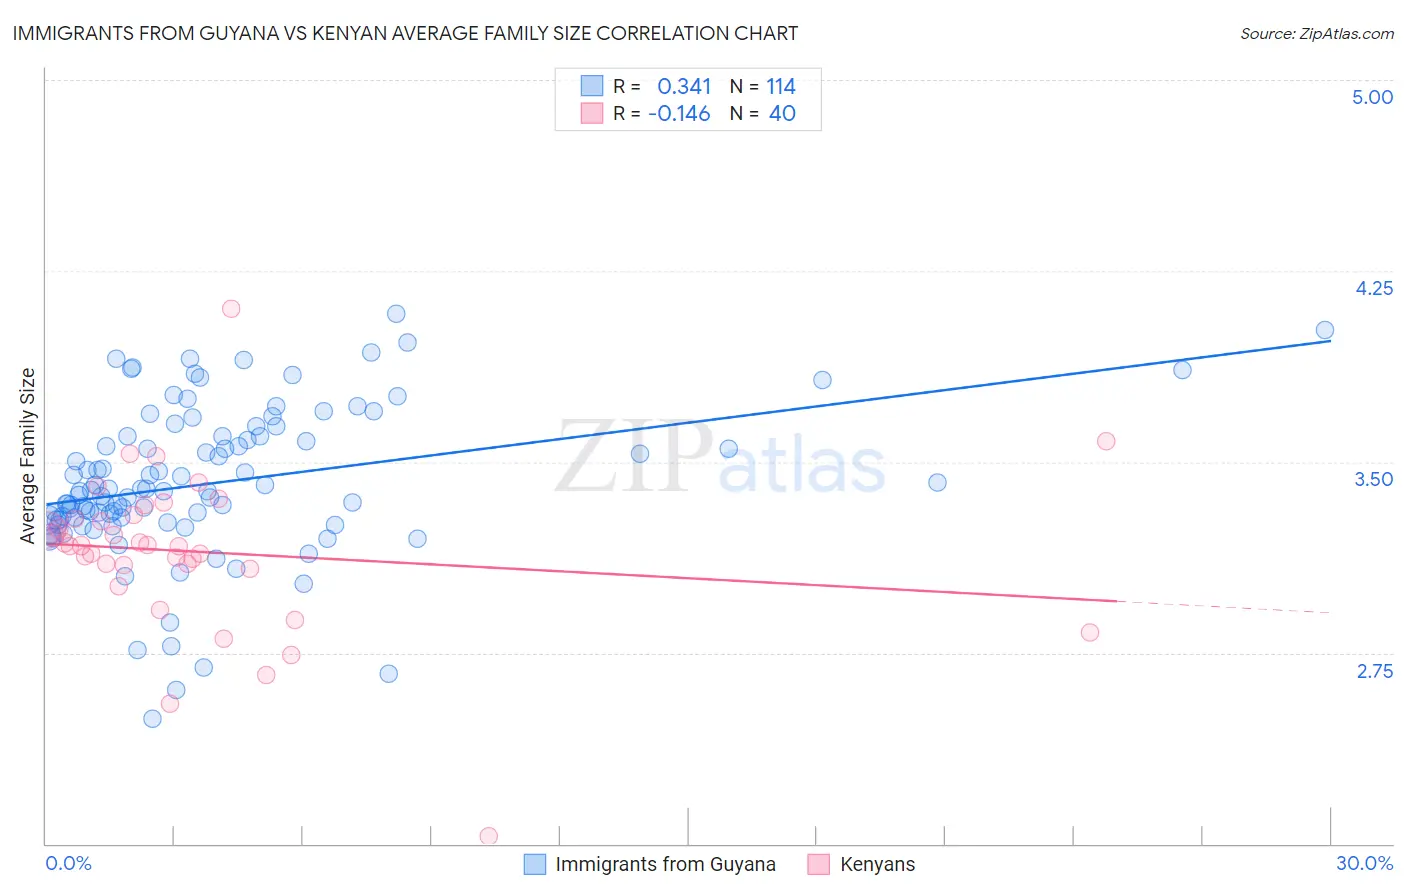
Immigrants from Guyana vs Kenyan Average Family Size Correlation Chart
The statistical analysis conducted on geographies consisting of 183,692,650 people shows a mild positive correlation between the proportion of Immigrants from Guyana and average family size in the United States with a correlation coefficient (R) of 0.341 and weighted average of 3.40. Similarly, the statistical analysis conducted on geographies consisting of 168,172,391 people shows a poor negative correlation between the proportion of Kenyans and average family size in the United States with a correlation coefficient (R) of -0.146 and weighted average of 3.21, a difference of 5.9%.
Average Family Size Correlation Summary
| Measurement | Immigrants from Guyana | Kenyan |
| Minimum | 2.49 | 2.03 |
| Maximum | 4.08 | 4.10 |
| Range | 1.59 | 2.07 |
| Mean | 3.42 | 3.15 |
| Median | 3.38 | 3.17 |
| Interquartile 25% (IQ1) | 3.27 | 3.09 |
| Interquartile 75% (IQ3) | 3.60 | 3.28 |
| Interquartile Range (IQR) | 0.33 | 0.20 |
| Standard Deviation (Sample) | 0.30 | 0.32 |
| Standard Deviation (Population) | 0.30 | 0.32 |
Similar Demographics by Average Family Size
Demographics Similar to Immigrants from Guyana by Average Family Size
In terms of average family size, the demographic groups most similar to Immigrants from Guyana are Guatemalan (3.40, a difference of 0.050%), Hispanic or Latino (3.41, a difference of 0.11%), Guyanese (3.40, a difference of 0.14%), Hawaiian (3.41, a difference of 0.16%), and Immigrants from Guatemala (3.41, a difference of 0.19%).
| Demographics | Rating | Rank | Average Family Size |
| Nepalese | 100.0 /100 | #29 | Exceptional 3.42 |
| Samoans | 100.0 /100 | #30 | Exceptional 3.42 |
| Central Americans | 100.0 /100 | #31 | Exceptional 3.41 |
| Immigrants | Guatemala | 100.0 /100 | #32 | Exceptional 3.41 |
| Hawaiians | 100.0 /100 | #33 | Exceptional 3.41 |
| Hispanics or Latinos | 100.0 /100 | #34 | Exceptional 3.41 |
| Guatemalans | 100.0 /100 | #35 | Exceptional 3.40 |
| Immigrants | Guyana | 100.0 /100 | #36 | Exceptional 3.40 |
| Guyanese | 100.0 /100 | #37 | Exceptional 3.40 |
| Immigrants | Belize | 100.0 /100 | #38 | Exceptional 3.39 |
| Immigrants | Haiti | 100.0 /100 | #39 | Exceptional 3.39 |
| Belizeans | 100.0 /100 | #40 | Exceptional 3.39 |
| Marshallese | 100.0 /100 | #41 | Exceptional 3.38 |
| Immigrants | Vietnam | 100.0 /100 | #42 | Exceptional 3.38 |
| Immigrants | Philippines | 100.0 /100 | #43 | Exceptional 3.37 |
Demographics Similar to Kenyans by Average Family Size
In terms of average family size, the demographic groups most similar to Kenyans are Senegalese (3.21, a difference of 0.0%), Choctaw (3.21, a difference of 0.010%), Immigrants from Sudan (3.22, a difference of 0.020%), Immigrants from Israel (3.22, a difference of 0.030%), and Immigrants from Zaire (3.22, a difference of 0.050%).
| Demographics | Rating | Rank | Average Family Size |
| Burmese | 31.0 /100 | #190 | Fair 3.22 |
| Immigrants | Zaire | 30.5 /100 | #191 | Fair 3.22 |
| Immigrants | Eastern Africa | 30.1 /100 | #192 | Fair 3.22 |
| Immigrants | Israel | 29.3 /100 | #193 | Fair 3.22 |
| Immigrants | Sudan | 29.1 /100 | #194 | Fair 3.22 |
| Choctaw | 28.3 /100 | #195 | Fair 3.21 |
| Senegalese | 28.2 /100 | #196 | Fair 3.21 |
| Kenyans | 28.0 /100 | #197 | Fair 3.21 |
| Immigrants | Azores | 21.7 /100 | #198 | Fair 3.21 |
| Hmong | 20.7 /100 | #199 | Fair 3.21 |
| Immigrants | Kenya | 19.2 /100 | #200 | Poor 3.21 |
| Immigrants | Morocco | 18.5 /100 | #201 | Poor 3.21 |
| Immigrants | India | 18.5 /100 | #202 | Poor 3.21 |
| Immigrants | Nepal | 18.1 /100 | #203 | Poor 3.21 |
| Immigrants | Poland | 16.6 /100 | #204 | Poor 3.20 |