Immigrants from Grenada vs Pakistani In Labor Force | Age 20-24
COMPARE
Immigrants from Grenada
Pakistani
In Labor Force | Age 20-24
In Labor Force | Age 20-24 Comparison
Immigrants from Grenada
Pakistanis
67.2%
IN LABOR FORCE | AGE 20-24
0.0/ 100
METRIC RATING
344th/ 347
METRIC RANK
75.8%
IN LABOR FORCE | AGE 20-24
94.1/ 100
METRIC RATING
122nd/ 347
METRIC RANK
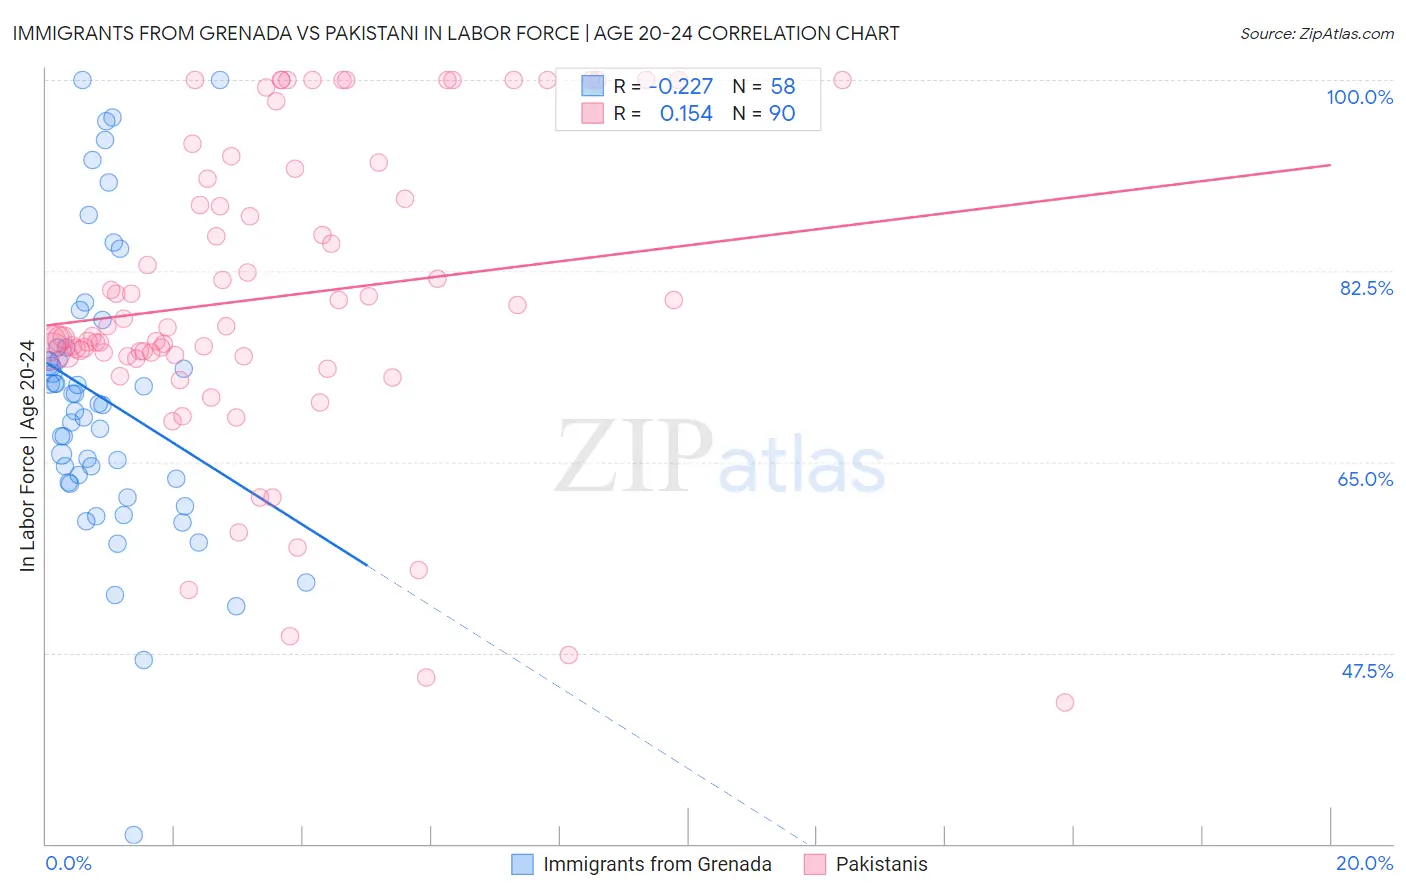
Immigrants from Grenada vs Pakistani In Labor Force | Age 20-24 Correlation Chart
The statistical analysis conducted on geographies consisting of 67,199,646 people shows a weak negative correlation between the proportion of Immigrants from Grenada and labor force participation rate among population between the ages 20 and 24 in the United States with a correlation coefficient (R) of -0.227 and weighted average of 67.2%. Similarly, the statistical analysis conducted on geographies consisting of 335,293,988 people shows a poor positive correlation between the proportion of Pakistanis and labor force participation rate among population between the ages 20 and 24 in the United States with a correlation coefficient (R) of 0.154 and weighted average of 75.8%, a difference of 12.9%.
In Labor Force | Age 20-24 Correlation Summary
| Measurement | Immigrants from Grenada | Pakistani |
| Minimum | 30.8% | 42.9% |
| Maximum | 100.0% | 100.0% |
| Range | 69.2% | 57.1% |
| Mean | 70.7% | 80.0% |
| Median | 70.3% | 76.9% |
| Interquartile 25% (IQ1) | 63.1% | 74.7% |
| Interquartile 75% (IQ3) | 75.5% | 90.9% |
| Interquartile Range (IQR) | 12.4% | 16.2% |
| Standard Deviation (Sample) | 13.3% | 13.9% |
| Standard Deviation (Population) | 13.1% | 13.8% |
Similar Demographics by In Labor Force | Age 20-24
Demographics Similar to Immigrants from Grenada by In Labor Force | Age 20-24
In terms of in labor force | age 20-24, the demographic groups most similar to Immigrants from Grenada are Puerto Rican (68.3%, a difference of 1.7%), Hopi (66.0%, a difference of 1.7%), Immigrants from St. Vincent and the Grenadines (68.4%, a difference of 1.8%), Tohono O'odham (68.6%, a difference of 2.1%), and Menominee (68.7%, a difference of 2.3%).
| Demographics | Rating | Rank | In Labor Force | Age 20-24 |
| Yuman | 0.0 /100 | #333 | Tragic 70.3% |
| British West Indians | 0.0 /100 | #334 | Tragic 70.0% |
| Immigrants | Barbados | 0.0 /100 | #335 | Tragic 69.7% |
| Immigrants | Guyana | 0.0 /100 | #336 | Tragic 69.3% |
| Guyanese | 0.0 /100 | #337 | Tragic 69.2% |
| Pima | 0.0 /100 | #338 | Tragic 69.0% |
| Immigrants | Yemen | 0.0 /100 | #339 | Tragic 68.9% |
| Menominee | 0.0 /100 | #340 | Tragic 68.7% |
| Tohono O'odham | 0.0 /100 | #341 | Tragic 68.6% |
| Immigrants | St. Vincent and the Grenadines | 0.0 /100 | #342 | Tragic 68.4% |
| Puerto Ricans | 0.0 /100 | #343 | Tragic 68.3% |
| Immigrants | Grenada | 0.0 /100 | #344 | Tragic 67.2% |
| Hopi | 0.0 /100 | #345 | Tragic 66.0% |
| Lumbee | 0.0 /100 | #346 | Tragic 65.5% |
| Navajo | 0.0 /100 | #347 | Tragic 64.8% |
Demographics Similar to Pakistanis by In Labor Force | Age 20-24
In terms of in labor force | age 20-24, the demographic groups most similar to Pakistanis are Immigrants from Bulgaria (75.8%, a difference of 0.0%), Immigrants from Serbia (75.8%, a difference of 0.010%), Immigrants from Sierra Leone (75.8%, a difference of 0.020%), Immigrants from Africa (75.8%, a difference of 0.030%), and Immigrants from Scotland (75.8%, a difference of 0.030%).
| Demographics | Rating | Rank | In Labor Force | Age 20-24 |
| Alaska Natives | 95.1 /100 | #115 | Exceptional 75.9% |
| Immigrants | North America | 95.0 /100 | #116 | Exceptional 75.9% |
| Assyrians/Chaldeans/Syriacs | 94.9 /100 | #117 | Exceptional 75.9% |
| Spanish Americans | 94.8 /100 | #118 | Exceptional 75.8% |
| Immigrants | Portugal | 94.8 /100 | #119 | Exceptional 75.8% |
| Immigrants | Africa | 94.6 /100 | #120 | Exceptional 75.8% |
| Immigrants | Serbia | 94.3 /100 | #121 | Exceptional 75.8% |
| Pakistanis | 94.1 /100 | #122 | Exceptional 75.8% |
| Immigrants | Bulgaria | 94.1 /100 | #123 | Exceptional 75.8% |
| Immigrants | Sierra Leone | 93.8 /100 | #124 | Exceptional 75.8% |
| Immigrants | Scotland | 93.7 /100 | #125 | Exceptional 75.8% |
| Brazilians | 93.0 /100 | #126 | Exceptional 75.8% |
| Sub-Saharan Africans | 90.9 /100 | #127 | Exceptional 75.7% |
| Immigrants | Afghanistan | 89.4 /100 | #128 | Excellent 75.6% |
| Iroquois | 89.1 /100 | #129 | Excellent 75.6% |