Immigrants from Dominica vs Pakistani In Labor Force | Age 20-24
COMPARE
Immigrants from Dominica
Pakistani
In Labor Force | Age 20-24
In Labor Force | Age 20-24 Comparison
Immigrants from Dominica
Pakistanis
71.9%
IN LABOR FORCE | AGE 20-24
0.0/ 100
METRIC RATING
313th/ 347
METRIC RANK
75.8%
IN LABOR FORCE | AGE 20-24
94.1/ 100
METRIC RATING
122nd/ 347
METRIC RANK
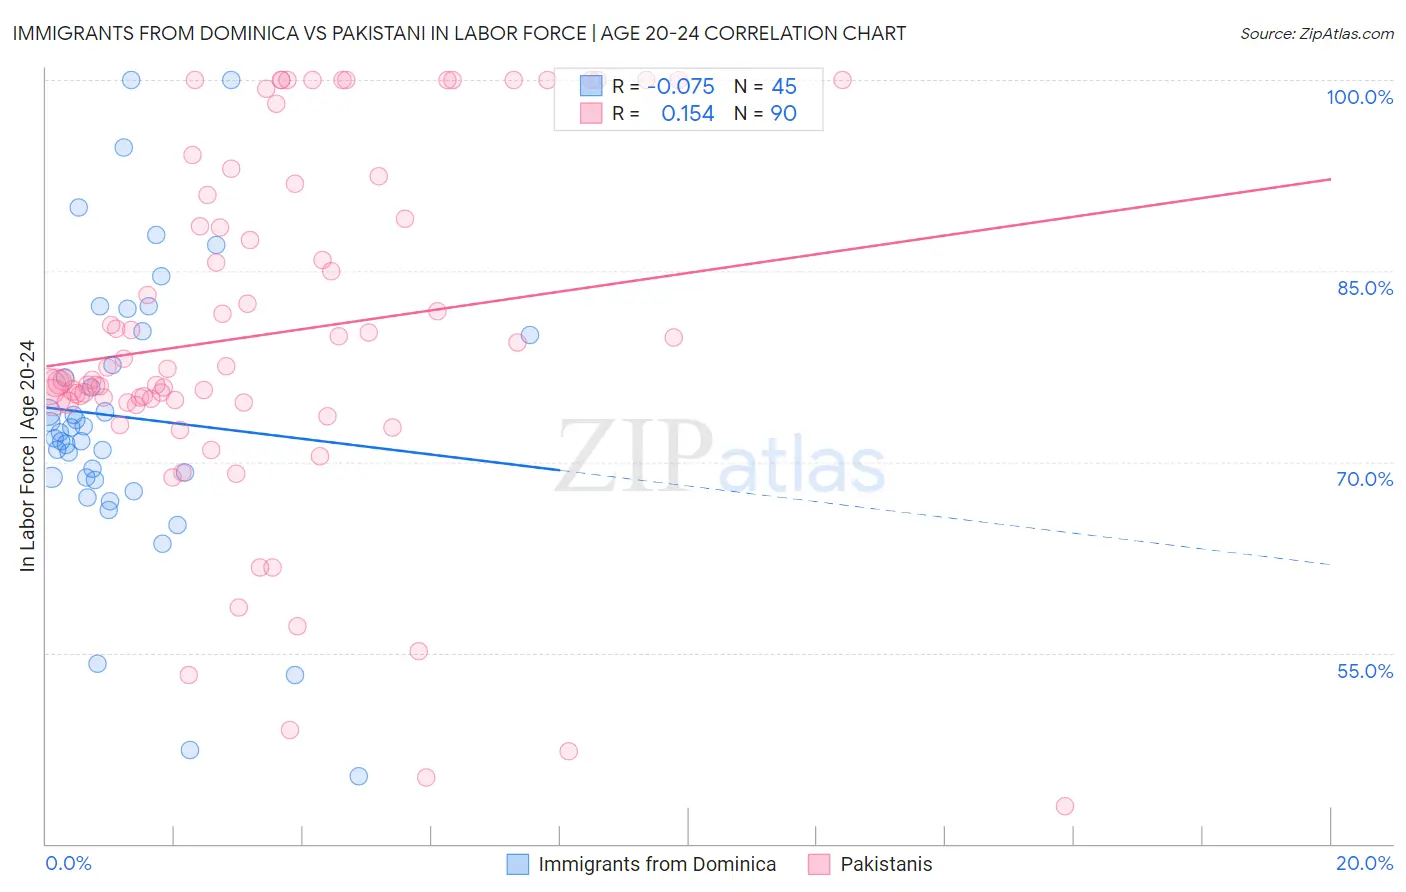
Immigrants from Dominica vs Pakistani In Labor Force | Age 20-24 Correlation Chart
The statistical analysis conducted on geographies consisting of 83,795,907 people shows a slight negative correlation between the proportion of Immigrants from Dominica and labor force participation rate among population between the ages 20 and 24 in the United States with a correlation coefficient (R) of -0.075 and weighted average of 71.9%. Similarly, the statistical analysis conducted on geographies consisting of 335,293,988 people shows a poor positive correlation between the proportion of Pakistanis and labor force participation rate among population between the ages 20 and 24 in the United States with a correlation coefficient (R) of 0.154 and weighted average of 75.8%, a difference of 5.5%.
In Labor Force | Age 20-24 Correlation Summary
| Measurement | Immigrants from Dominica | Pakistani |
| Minimum | 45.3% | 42.9% |
| Maximum | 100.0% | 100.0% |
| Range | 54.7% | 57.1% |
| Mean | 73.5% | 80.0% |
| Median | 72.3% | 76.9% |
| Interquartile 25% (IQ1) | 68.7% | 74.7% |
| Interquartile 75% (IQ3) | 80.1% | 90.9% |
| Interquartile Range (IQR) | 11.4% | 16.2% |
| Standard Deviation (Sample) | 11.4% | 13.9% |
| Standard Deviation (Population) | 11.3% | 13.8% |
Similar Demographics by In Labor Force | Age 20-24
Demographics Similar to Immigrants from Dominica by In Labor Force | Age 20-24
In terms of in labor force | age 20-24, the demographic groups most similar to Immigrants from Dominica are Indian (Asian) (71.9%, a difference of 0.010%), Immigrants from Caribbean (71.9%, a difference of 0.050%), Immigrants from Iran (71.8%, a difference of 0.090%), Apache (72.0%, a difference of 0.12%), and Immigrants from Cuba (72.0%, a difference of 0.13%).
| Demographics | Rating | Rank | In Labor Force | Age 20-24 |
| Immigrants | Jamaica | 0.0 /100 | #306 | Tragic 72.4% |
| Immigrants | Ecuador | 0.0 /100 | #307 | Tragic 72.3% |
| Soviet Union | 0.0 /100 | #308 | Tragic 72.3% |
| Tsimshian | 0.0 /100 | #309 | Tragic 72.3% |
| Immigrants | Cuba | 0.0 /100 | #310 | Tragic 72.0% |
| Apache | 0.0 /100 | #311 | Tragic 72.0% |
| Immigrants | Caribbean | 0.0 /100 | #312 | Tragic 71.9% |
| Immigrants | Dominica | 0.0 /100 | #313 | Tragic 71.9% |
| Indians (Asian) | 0.0 /100 | #314 | Tragic 71.9% |
| Immigrants | Iran | 0.0 /100 | #315 | Tragic 71.8% |
| Immigrants | Eastern Asia | 0.0 /100 | #316 | Tragic 71.8% |
| Immigrants | Armenia | 0.0 /100 | #317 | Tragic 71.7% |
| Immigrants | Hong Kong | 0.0 /100 | #318 | Tragic 71.6% |
| Immigrants | Israel | 0.0 /100 | #319 | Tragic 71.6% |
| Trinidadians and Tobagonians | 0.0 /100 | #320 | Tragic 71.5% |
Demographics Similar to Pakistanis by In Labor Force | Age 20-24
In terms of in labor force | age 20-24, the demographic groups most similar to Pakistanis are Immigrants from Bulgaria (75.8%, a difference of 0.0%), Immigrants from Serbia (75.8%, a difference of 0.010%), Immigrants from Sierra Leone (75.8%, a difference of 0.020%), Immigrants from Africa (75.8%, a difference of 0.030%), and Immigrants from Scotland (75.8%, a difference of 0.030%).
| Demographics | Rating | Rank | In Labor Force | Age 20-24 |
| Alaska Natives | 95.1 /100 | #115 | Exceptional 75.9% |
| Immigrants | North America | 95.0 /100 | #116 | Exceptional 75.9% |
| Assyrians/Chaldeans/Syriacs | 94.9 /100 | #117 | Exceptional 75.9% |
| Spanish Americans | 94.8 /100 | #118 | Exceptional 75.8% |
| Immigrants | Portugal | 94.8 /100 | #119 | Exceptional 75.8% |
| Immigrants | Africa | 94.6 /100 | #120 | Exceptional 75.8% |
| Immigrants | Serbia | 94.3 /100 | #121 | Exceptional 75.8% |
| Pakistanis | 94.1 /100 | #122 | Exceptional 75.8% |
| Immigrants | Bulgaria | 94.1 /100 | #123 | Exceptional 75.8% |
| Immigrants | Sierra Leone | 93.8 /100 | #124 | Exceptional 75.8% |
| Immigrants | Scotland | 93.7 /100 | #125 | Exceptional 75.8% |
| Brazilians | 93.0 /100 | #126 | Exceptional 75.8% |
| Sub-Saharan Africans | 90.9 /100 | #127 | Exceptional 75.7% |
| Immigrants | Afghanistan | 89.4 /100 | #128 | Excellent 75.6% |
| Iroquois | 89.1 /100 | #129 | Excellent 75.6% |