Macedonian vs Pakistani In Labor Force | Age 20-24
COMPARE
Macedonian
Pakistani
In Labor Force | Age 20-24
In Labor Force | Age 20-24 Comparison
Macedonians
Pakistanis
76.0%
IN LABOR FORCE | AGE 20-24
97.2/ 100
METRIC RATING
104th/ 347
METRIC RANK
75.8%
IN LABOR FORCE | AGE 20-24
94.1/ 100
METRIC RATING
122nd/ 347
METRIC RANK
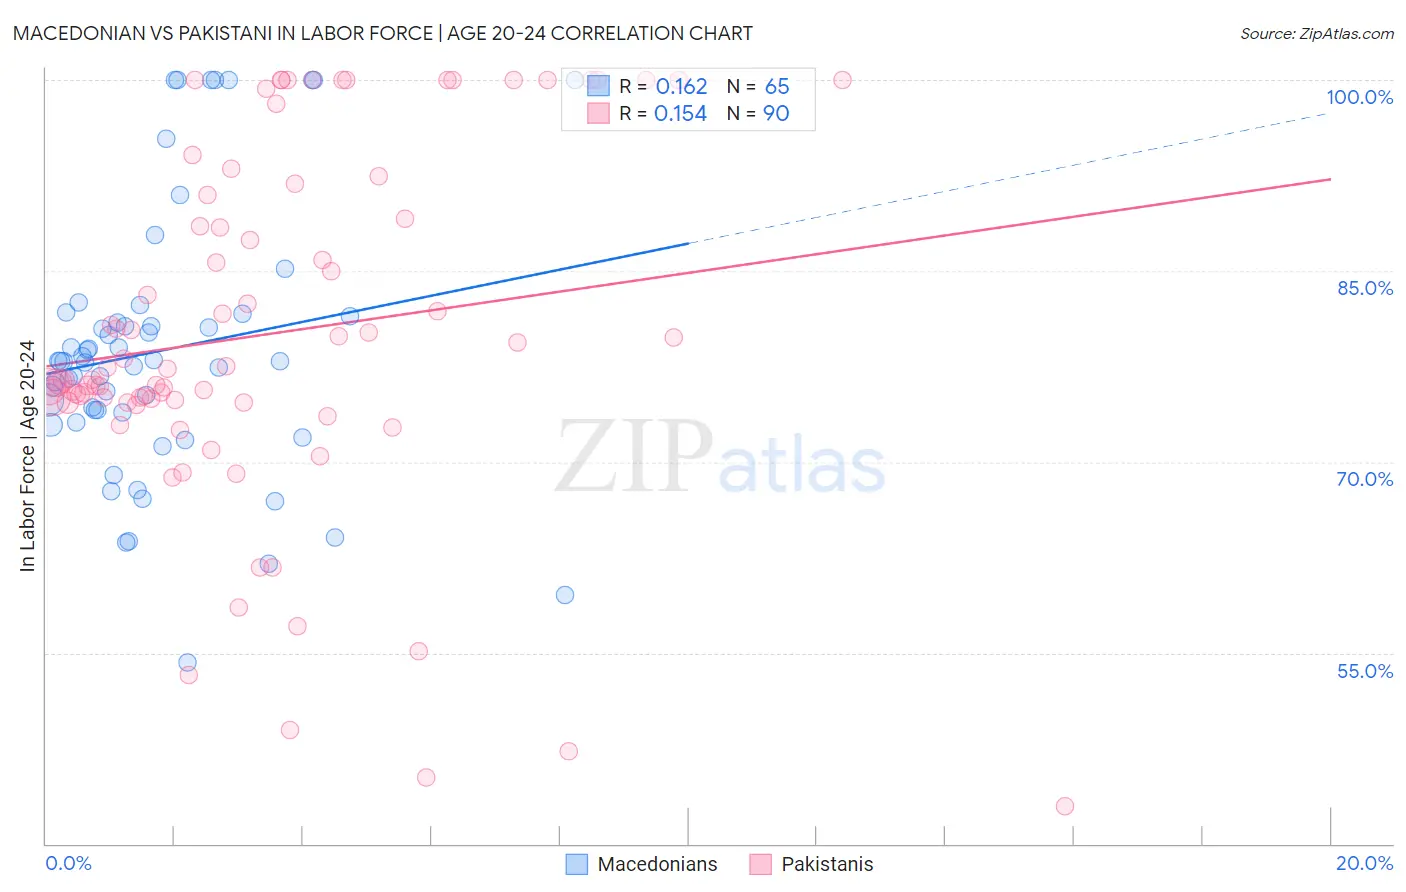
Macedonian vs Pakistani In Labor Force | Age 20-24 Correlation Chart
The statistical analysis conducted on geographies consisting of 132,643,632 people shows a poor positive correlation between the proportion of Macedonians and labor force participation rate among population between the ages 20 and 24 in the United States with a correlation coefficient (R) of 0.162 and weighted average of 76.0%. Similarly, the statistical analysis conducted on geographies consisting of 335,293,988 people shows a poor positive correlation between the proportion of Pakistanis and labor force participation rate among population between the ages 20 and 24 in the United States with a correlation coefficient (R) of 0.154 and weighted average of 75.8%, a difference of 0.28%.
In Labor Force | Age 20-24 Correlation Summary
| Measurement | Macedonian | Pakistani |
| Minimum | 54.2% | 42.9% |
| Maximum | 100.0% | 100.0% |
| Range | 45.8% | 57.1% |
| Mean | 78.8% | 80.0% |
| Median | 77.9% | 76.9% |
| Interquartile 25% (IQ1) | 73.5% | 74.7% |
| Interquartile 75% (IQ3) | 81.5% | 90.9% |
| Interquartile Range (IQR) | 8.1% | 16.2% |
| Standard Deviation (Sample) | 10.6% | 13.9% |
| Standard Deviation (Population) | 10.5% | 13.8% |
Demographics Similar to Macedonians and Pakistanis by In Labor Force | Age 20-24
In terms of in labor force | age 20-24, the demographic groups most similar to Macedonians are Immigrants from Nepal (76.0%, a difference of 0.0%), Immigrants from Uganda (76.0%, a difference of 0.020%), Immigrants from North Macedonia (76.1%, a difference of 0.040%), Greek (76.0%, a difference of 0.040%), and Iraqi (76.0%, a difference of 0.070%). Similarly, the demographic groups most similar to Pakistanis are Immigrants from Bulgaria (75.8%, a difference of 0.0%), Immigrants from Serbia (75.8%, a difference of 0.010%), Immigrants from Africa (75.8%, a difference of 0.030%), Assyrian/Chaldean/Syriac (75.9%, a difference of 0.050%), and Spanish American (75.8%, a difference of 0.050%).
| Demographics | Rating | Rank | In Labor Force | Age 20-24 |
| Immigrants | North Macedonia | 97.5 /100 | #103 | Exceptional 76.1% |
| Macedonians | 97.2 /100 | #104 | Exceptional 76.0% |
| Immigrants | Nepal | 97.2 /100 | #105 | Exceptional 76.0% |
| Immigrants | Uganda | 97.1 /100 | #106 | Exceptional 76.0% |
| Greeks | 96.9 /100 | #107 | Exceptional 76.0% |
| Iraqis | 96.6 /100 | #108 | Exceptional 76.0% |
| Cherokee | 95.8 /100 | #109 | Exceptional 75.9% |
| Immigrants | Morocco | 95.8 /100 | #110 | Exceptional 75.9% |
| Ukrainians | 95.7 /100 | #111 | Exceptional 75.9% |
| Immigrants | Canada | 95.6 /100 | #112 | Exceptional 75.9% |
| Immigrants | Netherlands | 95.3 /100 | #113 | Exceptional 75.9% |
| Immigrants | Zimbabwe | 95.1 /100 | #114 | Exceptional 75.9% |
| Alaska Natives | 95.1 /100 | #115 | Exceptional 75.9% |
| Immigrants | North America | 95.0 /100 | #116 | Exceptional 75.9% |
| Assyrians/Chaldeans/Syriacs | 94.9 /100 | #117 | Exceptional 75.9% |
| Spanish Americans | 94.8 /100 | #118 | Exceptional 75.8% |
| Immigrants | Portugal | 94.8 /100 | #119 | Exceptional 75.8% |
| Immigrants | Africa | 94.6 /100 | #120 | Exceptional 75.8% |
| Immigrants | Serbia | 94.3 /100 | #121 | Exceptional 75.8% |
| Pakistanis | 94.1 /100 | #122 | Exceptional 75.8% |
| Immigrants | Bulgaria | 94.1 /100 | #123 | Exceptional 75.8% |