Immigrants from France vs Immigrants from El Salvador In Labor Force | Age > 16
COMPARE
Immigrants from France
Immigrants from El Salvador
In Labor Force | Age > 16
In Labor Force | Age > 16 Comparison
Immigrants from France
Immigrants from El Salvador
65.7%
IN LABOR FORCE | AGE > 16
96.4/ 100
METRIC RATING
119th/ 347
METRIC RANK
66.8%
IN LABOR FORCE | AGE > 16
100.0/ 100
METRIC RATING
40th/ 347
METRIC RANK
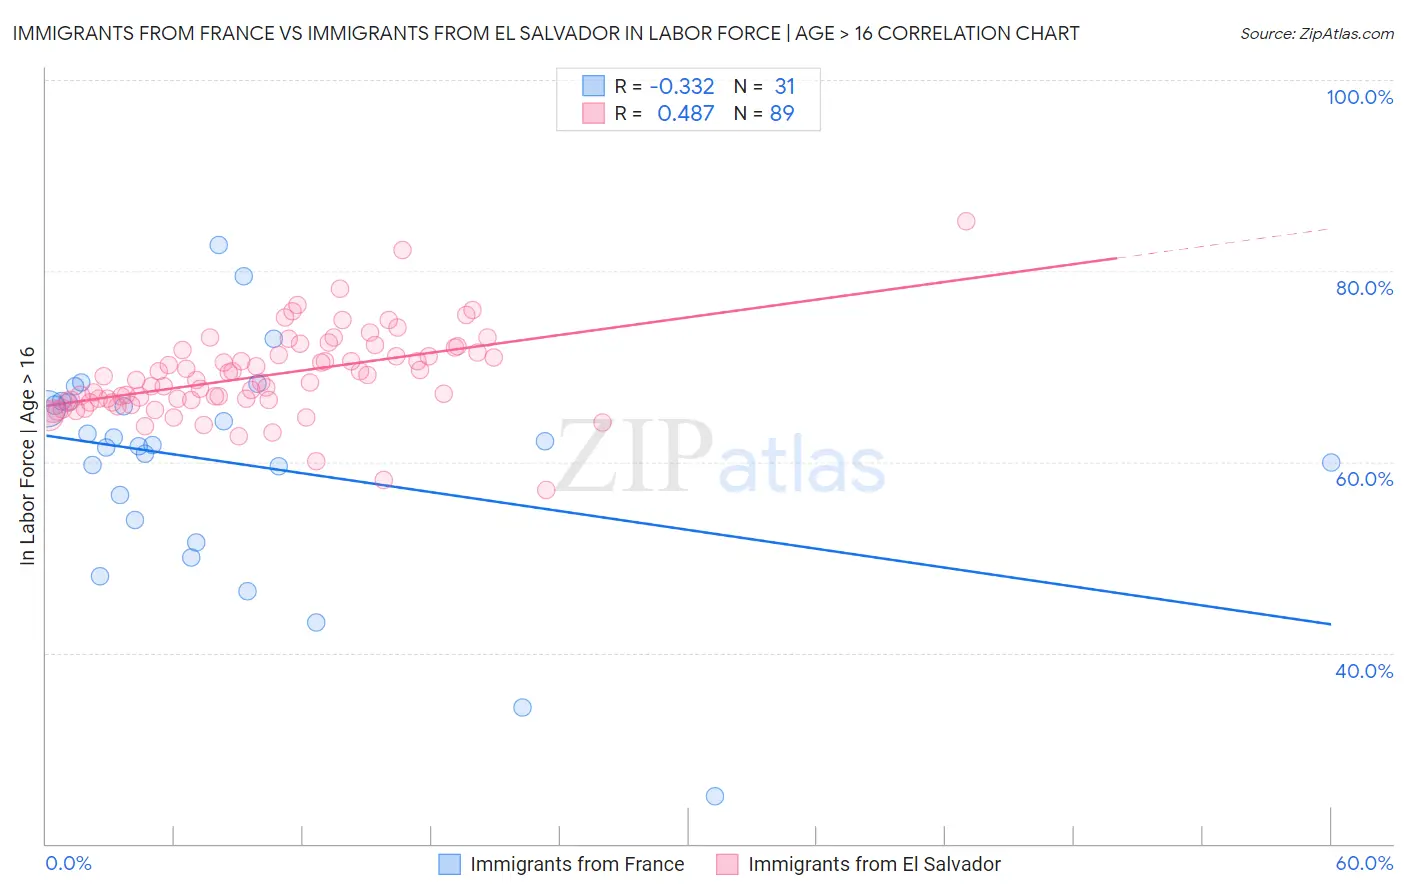
Immigrants from France vs Immigrants from El Salvador In Labor Force | Age > 16 Correlation Chart
The statistical analysis conducted on geographies consisting of 287,921,196 people shows a mild negative correlation between the proportion of Immigrants from France and labor force participation rate among population ages 16 and over in the United States with a correlation coefficient (R) of -0.332 and weighted average of 65.7%. Similarly, the statistical analysis conducted on geographies consisting of 357,803,560 people shows a moderate positive correlation between the proportion of Immigrants from El Salvador and labor force participation rate among population ages 16 and over in the United States with a correlation coefficient (R) of 0.487 and weighted average of 66.8%, a difference of 1.7%.
In Labor Force | Age > 16 Correlation Summary
| Measurement | Immigrants from France | Immigrants from El Salvador |
| Minimum | 25.0% | 57.0% |
| Maximum | 82.7% | 85.2% |
| Range | 57.7% | 28.2% |
| Mean | 59.9% | 69.0% |
| Median | 61.8% | 68.5% |
| Interquartile 25% (IQ1) | 53.9% | 66.4% |
| Interquartile 75% (IQ3) | 66.3% | 71.6% |
| Interquartile Range (IQR) | 12.4% | 5.3% |
| Standard Deviation (Sample) | 11.8% | 4.5% |
| Standard Deviation (Population) | 11.6% | 4.5% |
Similar Demographics by In Labor Force | Age > 16
Demographics Similar to Immigrants from France by In Labor Force | Age > 16
In terms of in labor force | age > 16, the demographic groups most similar to Immigrants from France are Immigrants from Iran (65.7%, a difference of 0.010%), Immigrants from Thailand (65.7%, a difference of 0.010%), Argentinean (65.7%, a difference of 0.020%), Immigrants from Hong Kong (65.7%, a difference of 0.020%), and Immigrants from Indonesia (65.7%, a difference of 0.030%).
| Demographics | Rating | Rank | In Labor Force | Age > 16 |
| Laotians | 97.4 /100 | #112 | Exceptional 65.8% |
| Pakistanis | 97.1 /100 | #113 | Exceptional 65.8% |
| Hondurans | 97.1 /100 | #114 | Exceptional 65.8% |
| Immigrants | Indonesia | 96.8 /100 | #115 | Exceptional 65.7% |
| Argentineans | 96.7 /100 | #116 | Exceptional 65.7% |
| Immigrants | Iran | 96.6 /100 | #117 | Exceptional 65.7% |
| Immigrants | Thailand | 96.6 /100 | #118 | Exceptional 65.7% |
| Immigrants | France | 96.4 /100 | #119 | Exceptional 65.7% |
| Immigrants | Hong Kong | 96.2 /100 | #120 | Exceptional 65.7% |
| New Zealanders | 96.0 /100 | #121 | Exceptional 65.7% |
| Immigrants | Ecuador | 95.9 /100 | #122 | Exceptional 65.7% |
| Immigrants | Iraq | 95.5 /100 | #123 | Exceptional 65.7% |
| Iraqis | 95.4 /100 | #124 | Exceptional 65.7% |
| Norwegians | 95.3 /100 | #125 | Exceptional 65.7% |
| Koreans | 95.3 /100 | #126 | Exceptional 65.7% |
Demographics Similar to Immigrants from El Salvador by In Labor Force | Age > 16
In terms of in labor force | age > 16, the demographic groups most similar to Immigrants from El Salvador are Immigrants from Zimbabwe (66.8%, a difference of 0.0%), Salvadoran (66.8%, a difference of 0.020%), Senegalese (66.7%, a difference of 0.10%), Luxembourger (66.7%, a difference of 0.12%), and Immigrants from Nigeria (66.9%, a difference of 0.17%).
| Demographics | Rating | Rank | In Labor Force | Age > 16 |
| Afghans | 100.0 /100 | #33 | Exceptional 67.1% |
| Immigrants | Ghana | 100.0 /100 | #34 | Exceptional 67.1% |
| Immigrants | South Central Asia | 100.0 /100 | #35 | Exceptional 67.1% |
| Immigrants | Western Africa | 100.0 /100 | #36 | Exceptional 67.1% |
| Immigrants | Afghanistan | 100.0 /100 | #37 | Exceptional 67.0% |
| Immigrants | Nigeria | 100.0 /100 | #38 | Exceptional 66.9% |
| Salvadorans | 100.0 /100 | #39 | Exceptional 66.8% |
| Immigrants | El Salvador | 100.0 /100 | #40 | Exceptional 66.8% |
| Immigrants | Zimbabwe | 100.0 /100 | #41 | Exceptional 66.8% |
| Senegalese | 100.0 /100 | #42 | Exceptional 66.7% |
| Luxembourgers | 100.0 /100 | #43 | Exceptional 66.7% |
| Immigrants | Pakistan | 100.0 /100 | #44 | Exceptional 66.7% |
| Immigrants | Brazil | 100.0 /100 | #45 | Exceptional 66.7% |
| Brazilians | 100.0 /100 | #46 | Exceptional 66.6% |
| Immigrants | Bulgaria | 100.0 /100 | #47 | Exceptional 66.6% |