Ukrainian vs Immigrants from South Central Asia In Labor Force | Age 35-44
COMPARE
Ukrainian
Immigrants from South Central Asia
In Labor Force | Age 35-44
In Labor Force | Age 35-44 Comparison
Ukrainians
Immigrants from South Central Asia
84.7%
IN LABOR FORCE | AGE 35-44
93.5/ 100
METRIC RATING
111th/ 347
METRIC RANK
85.0%
IN LABOR FORCE | AGE 35-44
98.7/ 100
METRIC RATING
75th/ 347
METRIC RANK
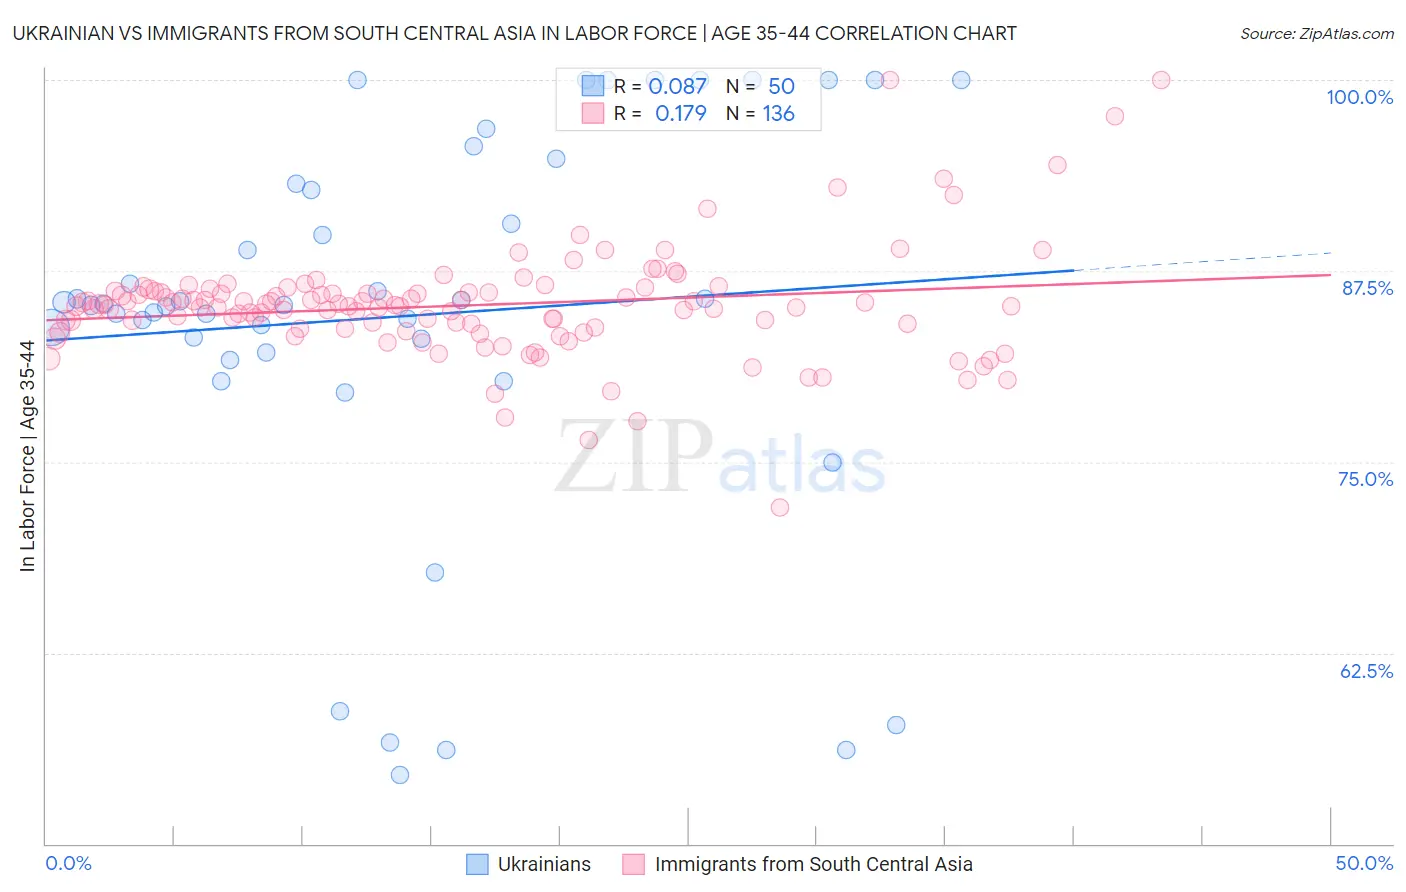
Ukrainian vs Immigrants from South Central Asia In Labor Force | Age 35-44 Correlation Chart
The statistical analysis conducted on geographies consisting of 448,358,650 people shows a slight positive correlation between the proportion of Ukrainians and labor force participation rate among population between the ages 35 and 44 in the United States with a correlation coefficient (R) of 0.087 and weighted average of 84.7%. Similarly, the statistical analysis conducted on geographies consisting of 472,756,854 people shows a poor positive correlation between the proportion of Immigrants from South Central Asia and labor force participation rate among population between the ages 35 and 44 in the United States with a correlation coefficient (R) of 0.179 and weighted average of 85.0%, a difference of 0.26%.
In Labor Force | Age 35-44 Correlation Summary
| Measurement | Ukrainian | Immigrants from South Central Asia |
| Minimum | 54.5% | 72.0% |
| Maximum | 100.0% | 100.0% |
| Range | 45.5% | 28.0% |
| Mean | 84.6% | 85.2% |
| Median | 85.3% | 85.2% |
| Interquartile 25% (IQ1) | 82.1% | 83.8% |
| Interquartile 75% (IQ3) | 93.2% | 86.1% |
| Interquartile Range (IQR) | 11.0% | 2.4% |
| Standard Deviation (Sample) | 12.7% | 3.6% |
| Standard Deviation (Population) | 12.6% | 3.6% |
Similar Demographics by In Labor Force | Age 35-44
Demographics Similar to Ukrainians by In Labor Force | Age 35-44
In terms of in labor force | age 35-44, the demographic groups most similar to Ukrainians are Immigrants from Western Africa (84.7%, a difference of 0.0%), Filipino (84.7%, a difference of 0.010%), Uruguayan (84.7%, a difference of 0.010%), Chilean (84.7%, a difference of 0.010%), and Bahamian (84.7%, a difference of 0.010%).
| Demographics | Rating | Rank | In Labor Force | Age 35-44 |
| Immigrants | Sweden | 95.2 /100 | #104 | Exceptional 84.8% |
| South Americans | 95.0 /100 | #105 | Exceptional 84.8% |
| Immigrants | Bahamas | 94.8 /100 | #106 | Exceptional 84.8% |
| Immigrants | Romania | 94.7 /100 | #107 | Exceptional 84.8% |
| Immigrants | Argentina | 94.5 /100 | #108 | Exceptional 84.8% |
| Immigrants | Russia | 94.5 /100 | #109 | Exceptional 84.8% |
| Filipinos | 93.8 /100 | #110 | Exceptional 84.7% |
| Ukrainians | 93.5 /100 | #111 | Exceptional 84.7% |
| Immigrants | Western Africa | 93.4 /100 | #112 | Exceptional 84.7% |
| Uruguayans | 93.3 /100 | #113 | Exceptional 84.7% |
| Chileans | 93.2 /100 | #114 | Exceptional 84.7% |
| Bahamians | 93.2 /100 | #115 | Exceptional 84.7% |
| Immigrants | Egypt | 92.7 /100 | #116 | Exceptional 84.7% |
| Immigrants | China | 92.3 /100 | #117 | Exceptional 84.7% |
| Immigrants | Eastern Asia | 92.1 /100 | #118 | Exceptional 84.7% |
Demographics Similar to Immigrants from South Central Asia by In Labor Force | Age 35-44
In terms of in labor force | age 35-44, the demographic groups most similar to Immigrants from South Central Asia are Colombian (85.0%, a difference of 0.010%), Immigrants from Cuba (84.9%, a difference of 0.010%), Immigrants from Turkey (84.9%, a difference of 0.010%), Immigrants from Singapore (85.0%, a difference of 0.020%), and Immigrants from Sri Lanka (85.0%, a difference of 0.020%).
| Demographics | Rating | Rank | In Labor Force | Age 35-44 |
| Italians | 99.1 /100 | #68 | Exceptional 85.0% |
| Sudanese | 99.0 /100 | #69 | Exceptional 85.0% |
| Brazilians | 99.0 /100 | #70 | Exceptional 85.0% |
| Russians | 99.0 /100 | #71 | Exceptional 85.0% |
| Immigrants | Singapore | 98.9 /100 | #72 | Exceptional 85.0% |
| Immigrants | Sri Lanka | 98.9 /100 | #73 | Exceptional 85.0% |
| Colombians | 98.8 /100 | #74 | Exceptional 85.0% |
| Immigrants | South Central Asia | 98.7 /100 | #75 | Exceptional 85.0% |
| Immigrants | Cuba | 98.6 /100 | #76 | Exceptional 84.9% |
| Immigrants | Turkey | 98.6 /100 | #77 | Exceptional 84.9% |
| Immigrants | Africa | 98.4 /100 | #78 | Exceptional 84.9% |
| Peruvians | 98.3 /100 | #79 | Exceptional 84.9% |
| Immigrants | Colombia | 98.3 /100 | #80 | Exceptional 84.9% |
| Immigrants | Eastern Europe | 98.3 /100 | #81 | Exceptional 84.9% |
| Immigrants | Sudan | 98.1 /100 | #82 | Exceptional 84.9% |