Immigrants from Europe vs Nicaraguan In Labor Force | Age 25-29
COMPARE
Immigrants from Europe
Nicaraguan
In Labor Force | Age 25-29
In Labor Force | Age 25-29 Comparison
Immigrants from Europe
Nicaraguans
85.2%
IN LABOR FORCE | AGE 25-29
96.8/ 100
METRIC RATING
83rd/ 347
METRIC RANK
83.1%
IN LABOR FORCE | AGE 25-29
0.0/ 100
METRIC RATING
284th/ 347
METRIC RANK
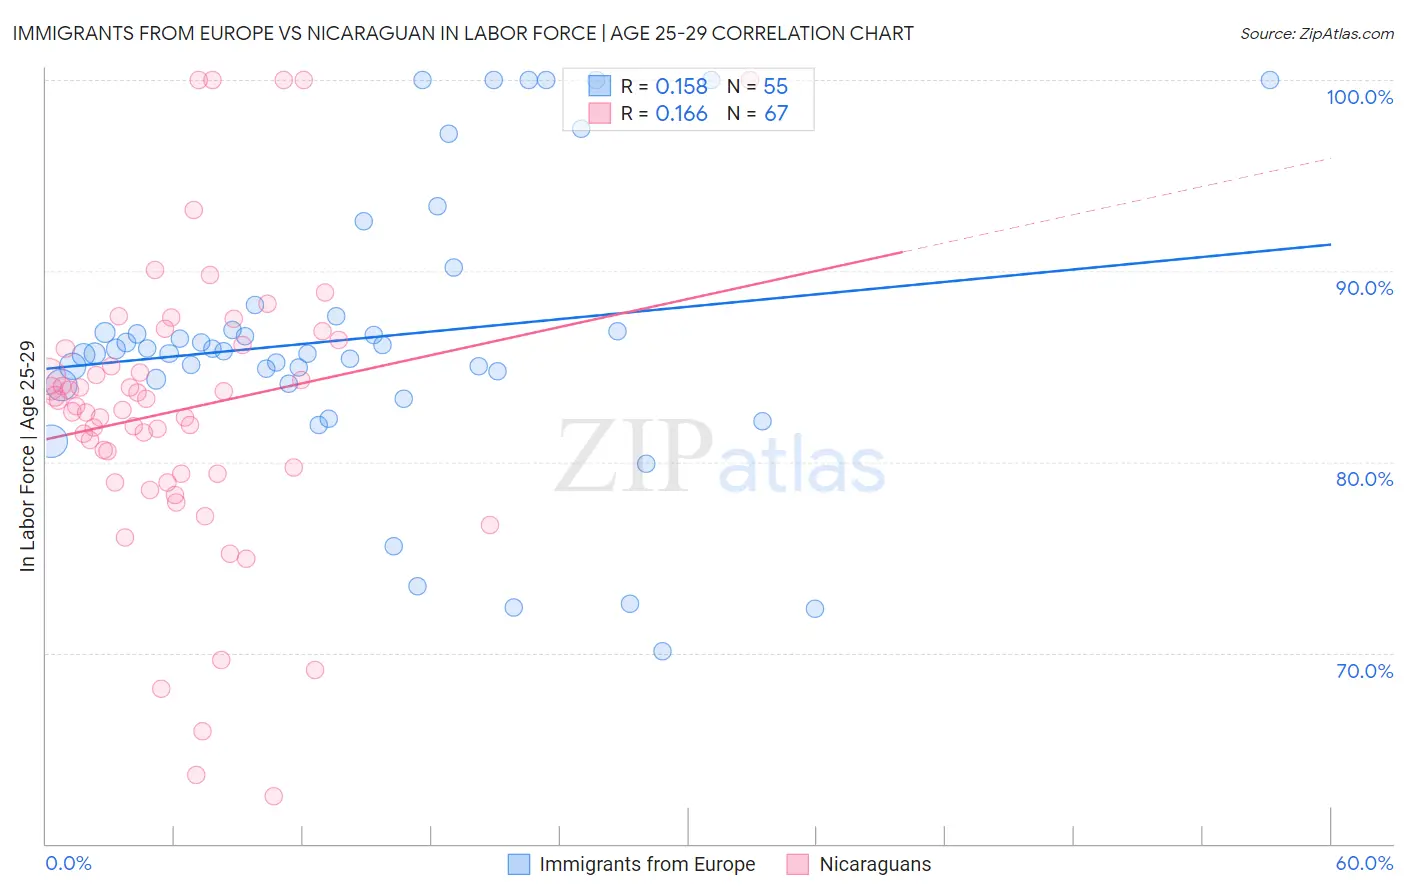
Immigrants from Europe vs Nicaraguan In Labor Force | Age 25-29 Correlation Chart
The statistical analysis conducted on geographies consisting of 546,633,730 people shows a poor positive correlation between the proportion of Immigrants from Europe and labor force participation rate among population between the ages 25 and 29 in the United States with a correlation coefficient (R) of 0.158 and weighted average of 85.2%. Similarly, the statistical analysis conducted on geographies consisting of 285,680,331 people shows a poor positive correlation between the proportion of Nicaraguans and labor force participation rate among population between the ages 25 and 29 in the United States with a correlation coefficient (R) of 0.166 and weighted average of 83.1%, a difference of 2.5%.
In Labor Force | Age 25-29 Correlation Summary
| Measurement | Immigrants from Europe | Nicaraguan |
| Minimum | 70.1% | 62.5% |
| Maximum | 100.0% | 100.0% |
| Range | 29.9% | 37.5% |
| Mean | 86.5% | 82.7% |
| Median | 85.8% | 82.9% |
| Interquartile 25% (IQ1) | 84.1% | 79.4% |
| Interquartile 75% (IQ3) | 87.6% | 86.1% |
| Interquartile Range (IQR) | 3.5% | 6.7% |
| Standard Deviation (Sample) | 7.4% | 7.7% |
| Standard Deviation (Population) | 7.3% | 7.7% |
Similar Demographics by In Labor Force | Age 25-29
Demographics Similar to Immigrants from Europe by In Labor Force | Age 25-29
In terms of in labor force | age 25-29, the demographic groups most similar to Immigrants from Europe are Immigrants from Eastern Europe (85.2%, a difference of 0.0%), Okinawan (85.2%, a difference of 0.010%), Immigrants from Africa (85.2%, a difference of 0.010%), Ukrainian (85.2%, a difference of 0.010%), and French Canadian (85.2%, a difference of 0.020%).
| Demographics | Rating | Rank | In Labor Force | Age 25-29 |
| Germans | 98.1 /100 | #76 | Exceptional 85.3% |
| Immigrants | South Central Asia | 97.9 /100 | #77 | Exceptional 85.2% |
| Immigrants | Egypt | 97.7 /100 | #78 | Exceptional 85.2% |
| Immigrants | Northern Africa | 97.6 /100 | #79 | Exceptional 85.2% |
| Immigrants | Zimbabwe | 97.6 /100 | #80 | Exceptional 85.2% |
| Immigrants | Northern Europe | 97.2 /100 | #81 | Exceptional 85.2% |
| Okinawans | 97.0 /100 | #82 | Exceptional 85.2% |
| Immigrants | Europe | 96.8 /100 | #83 | Exceptional 85.2% |
| Immigrants | Eastern Europe | 96.8 /100 | #84 | Exceptional 85.2% |
| Immigrants | Africa | 96.7 /100 | #85 | Exceptional 85.2% |
| Ukrainians | 96.7 /100 | #86 | Exceptional 85.2% |
| French Canadians | 96.5 /100 | #87 | Exceptional 85.2% |
| Immigrants | Croatia | 96.4 /100 | #88 | Exceptional 85.2% |
| Immigrants | France | 96.3 /100 | #89 | Exceptional 85.2% |
| Burmese | 95.9 /100 | #90 | Exceptional 85.1% |
Demographics Similar to Nicaraguans by In Labor Force | Age 25-29
In terms of in labor force | age 25-29, the demographic groups most similar to Nicaraguans are American (83.1%, a difference of 0.020%), Immigrants from the Azores (83.1%, a difference of 0.020%), Immigrants from Dominican Republic (83.1%, a difference of 0.030%), Belizean (83.1%, a difference of 0.030%), and Mexican American Indian (83.0%, a difference of 0.050%).
| Demographics | Rating | Rank | In Labor Force | Age 25-29 |
| Africans | 0.0 /100 | #277 | Tragic 83.2% |
| Immigrants | Cuba | 0.0 /100 | #278 | Tragic 83.2% |
| British West Indians | 0.0 /100 | #279 | Tragic 83.2% |
| Dominicans | 0.0 /100 | #280 | Tragic 83.2% |
| Immigrants | Dominican Republic | 0.0 /100 | #281 | Tragic 83.1% |
| Americans | 0.0 /100 | #282 | Tragic 83.1% |
| Immigrants | Azores | 0.0 /100 | #283 | Tragic 83.1% |
| Nicaraguans | 0.0 /100 | #284 | Tragic 83.1% |
| Belizeans | 0.0 /100 | #285 | Tragic 83.1% |
| Mexican American Indians | 0.0 /100 | #286 | Tragic 83.0% |
| Guyanese | 0.0 /100 | #287 | Tragic 83.0% |
| Ottawa | 0.0 /100 | #288 | Tragic 83.0% |
| Immigrants | Micronesia | 0.0 /100 | #289 | Tragic 83.0% |
| Immigrants | Bangladesh | 0.0 /100 | #290 | Tragic 83.0% |
| Hawaiians | 0.0 /100 | #291 | Tragic 83.0% |