Immigrants from England vs Immigrants from Belize In Labor Force | Age 25-29
COMPARE
Immigrants from England
Immigrants from Belize
In Labor Force | Age 25-29
In Labor Force | Age 25-29 Comparison
Immigrants from England
Immigrants from Belize
84.7%
IN LABOR FORCE | AGE 25-29
65.2/ 100
METRIC RATING
148th/ 347
METRIC RANK
82.8%
IN LABOR FORCE | AGE 25-29
0.0/ 100
METRIC RATING
302nd/ 347
METRIC RANK
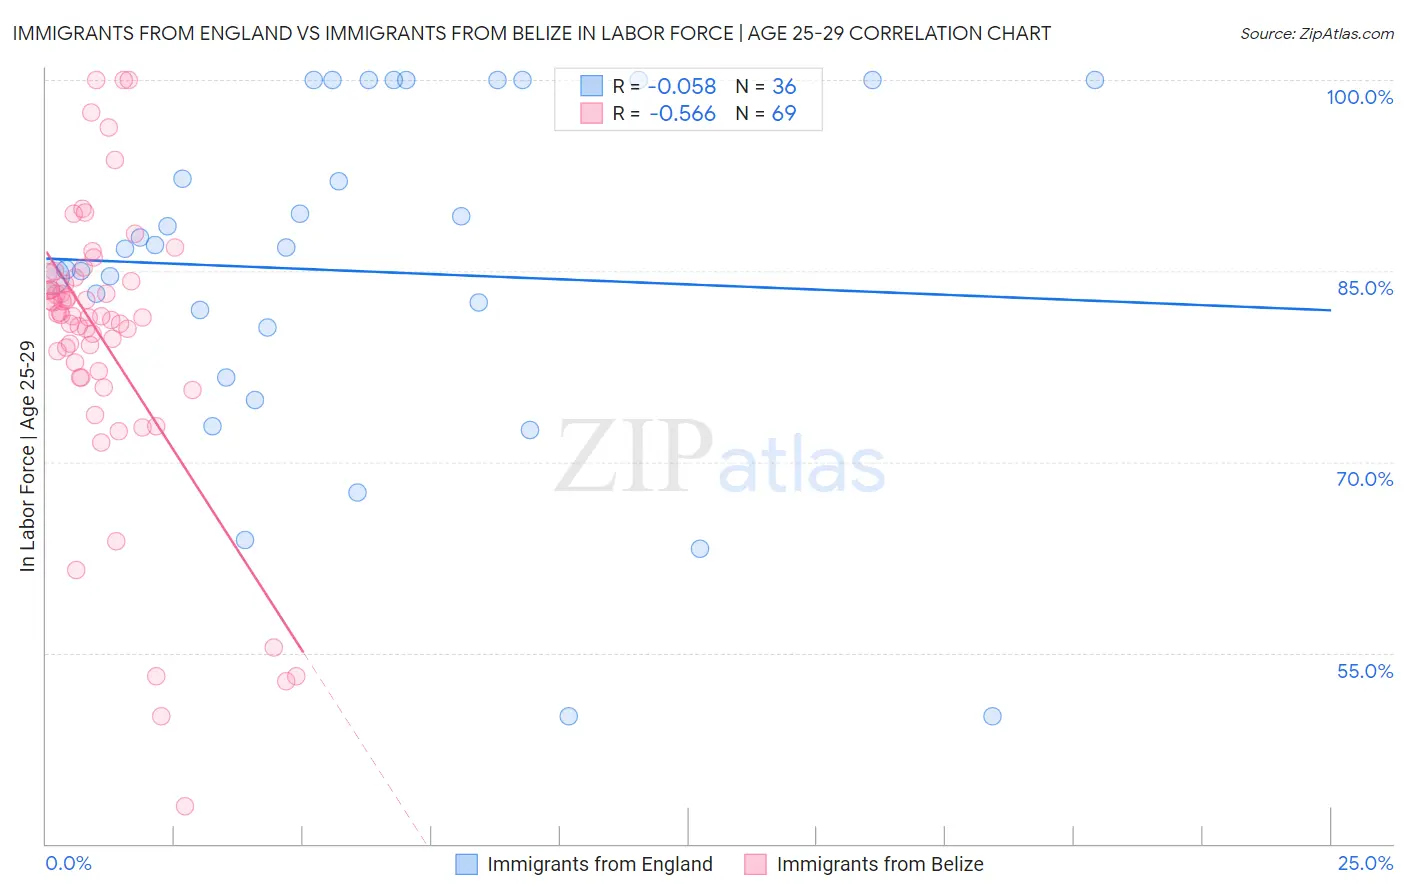
Immigrants from England vs Immigrants from Belize In Labor Force | Age 25-29 Correlation Chart
The statistical analysis conducted on geographies consisting of 391,692,823 people shows a slight negative correlation between the proportion of Immigrants from England and labor force participation rate among population between the ages 25 and 29 in the United States with a correlation coefficient (R) of -0.058 and weighted average of 84.7%. Similarly, the statistical analysis conducted on geographies consisting of 130,310,210 people shows a substantial negative correlation between the proportion of Immigrants from Belize and labor force participation rate among population between the ages 25 and 29 in the United States with a correlation coefficient (R) of -0.566 and weighted average of 82.8%, a difference of 2.3%.
In Labor Force | Age 25-29 Correlation Summary
| Measurement | Immigrants from England | Immigrants from Belize |
| Minimum | 50.0% | 42.9% |
| Maximum | 100.0% | 100.0% |
| Range | 50.0% | 57.1% |
| Mean | 85.0% | 79.6% |
| Median | 86.8% | 81.5% |
| Interquartile 25% (IQ1) | 78.6% | 76.9% |
| Interquartile 75% (IQ3) | 100.0% | 84.3% |
| Interquartile Range (IQR) | 21.4% | 7.5% |
| Standard Deviation (Sample) | 13.7% | 11.3% |
| Standard Deviation (Population) | 13.6% | 11.2% |
Similar Demographics by In Labor Force | Age 25-29
Demographics Similar to Immigrants from England by In Labor Force | Age 25-29
In terms of in labor force | age 25-29, the demographic groups most similar to Immigrants from England are Peruvian (84.7%, a difference of 0.0%), Swiss (84.7%, a difference of 0.0%), Immigrants from Asia (84.8%, a difference of 0.020%), Colombian (84.7%, a difference of 0.020%), and Immigrants from Pakistan (84.7%, a difference of 0.020%).
| Demographics | Rating | Rank | In Labor Force | Age 25-29 |
| Danes | 71.9 /100 | #141 | Good 84.8% |
| Pakistanis | 70.0 /100 | #142 | Good 84.8% |
| Sri Lankans | 69.2 /100 | #143 | Good 84.8% |
| Immigrants | Laos | 69.0 /100 | #144 | Good 84.8% |
| Immigrants | Senegal | 68.3 /100 | #145 | Good 84.8% |
| Icelanders | 68.2 /100 | #146 | Good 84.8% |
| Immigrants | Asia | 68.2 /100 | #147 | Good 84.8% |
| Immigrants | England | 65.2 /100 | #148 | Good 84.7% |
| Peruvians | 64.7 /100 | #149 | Good 84.7% |
| Swiss | 64.7 /100 | #150 | Good 84.7% |
| Colombians | 62.8 /100 | #151 | Good 84.7% |
| Immigrants | Pakistan | 62.7 /100 | #152 | Good 84.7% |
| Immigrants | Taiwan | 62.2 /100 | #153 | Good 84.7% |
| Immigrants | Sri Lanka | 61.7 /100 | #154 | Good 84.7% |
| Indians (Asian) | 61.6 /100 | #155 | Good 84.7% |
Demographics Similar to Immigrants from Belize by In Labor Force | Age 25-29
In terms of in labor force | age 25-29, the demographic groups most similar to Immigrants from Belize are Immigrants from Grenada (82.8%, a difference of 0.010%), Vietnamese (82.8%, a difference of 0.030%), Spanish American Indian (82.9%, a difference of 0.10%), Fijian (82.9%, a difference of 0.11%), and Native Hawaiian (82.9%, a difference of 0.12%).
| Demographics | Rating | Rank | In Labor Force | Age 25-29 |
| Chippewa | 0.0 /100 | #295 | Tragic 82.9% |
| Immigrants | Nicaragua | 0.0 /100 | #296 | Tragic 82.9% |
| Potawatomi | 0.0 /100 | #297 | Tragic 82.9% |
| Native Hawaiians | 0.0 /100 | #298 | Tragic 82.9% |
| Fijians | 0.0 /100 | #299 | Tragic 82.9% |
| Spanish American Indians | 0.0 /100 | #300 | Tragic 82.9% |
| Vietnamese | 0.0 /100 | #301 | Tragic 82.8% |
| Immigrants | Belize | 0.0 /100 | #302 | Tragic 82.8% |
| Immigrants | Grenada | 0.0 /100 | #303 | Tragic 82.8% |
| Immigrants | St. Vincent and the Grenadines | 0.0 /100 | #304 | Tragic 82.7% |
| Blacks/African Americans | 0.0 /100 | #305 | Tragic 82.6% |
| Blackfeet | 0.0 /100 | #306 | Tragic 82.6% |
| Cajuns | 0.0 /100 | #307 | Tragic 82.5% |
| Central American Indians | 0.0 /100 | #308 | Tragic 82.4% |
| Immigrants | Central America | 0.0 /100 | #309 | Tragic 82.4% |