Immigrants from El Salvador vs Blackfeet In Labor Force | Age > 16
COMPARE
Immigrants from El Salvador
Blackfeet
In Labor Force | Age > 16
In Labor Force | Age > 16 Comparison
Immigrants from El Salvador
Blackfeet
66.8%
IN LABOR FORCE | AGE > 16
100.0/ 100
METRIC RATING
40th/ 347
METRIC RANK
63.2%
IN LABOR FORCE | AGE > 16
0.0/ 100
METRIC RATING
311th/ 347
METRIC RANK
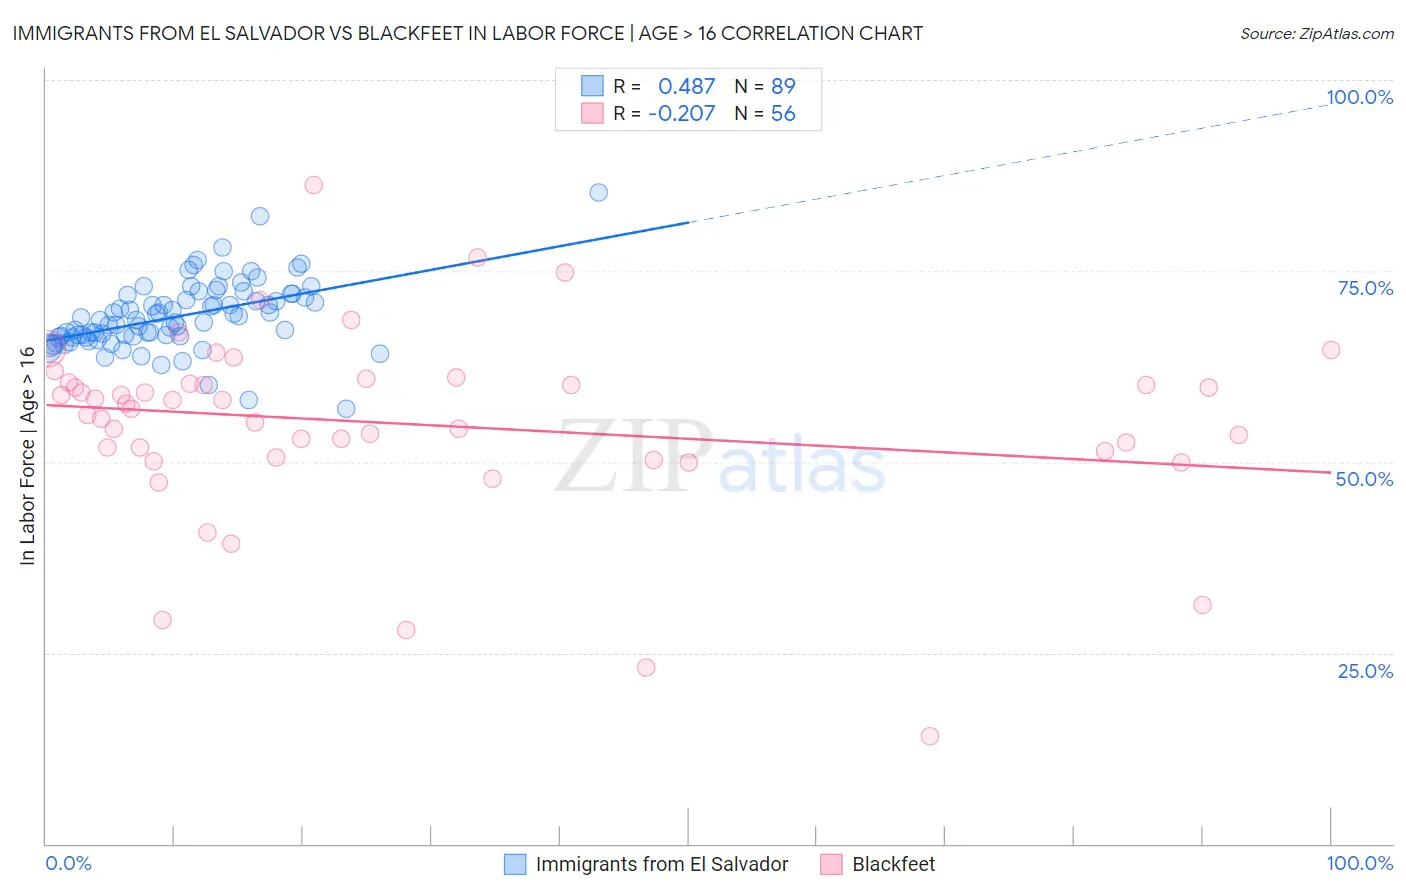
Immigrants from El Salvador vs Blackfeet In Labor Force | Age > 16 Correlation Chart
The statistical analysis conducted on geographies consisting of 357,803,560 people shows a moderate positive correlation between the proportion of Immigrants from El Salvador and labor force participation rate among population ages 16 and over in the United States with a correlation coefficient (R) of 0.487 and weighted average of 66.8%. Similarly, the statistical analysis conducted on geographies consisting of 309,565,086 people shows a weak negative correlation between the proportion of Blackfeet and labor force participation rate among population ages 16 and over in the United States with a correlation coefficient (R) of -0.207 and weighted average of 63.2%, a difference of 5.7%.
In Labor Force | Age > 16 Correlation Summary
| Measurement | Immigrants from El Salvador | Blackfeet |
| Minimum | 57.0% | 14.1% |
| Maximum | 85.2% | 86.2% |
| Range | 28.2% | 72.1% |
| Mean | 69.0% | 55.0% |
| Median | 68.5% | 57.3% |
| Interquartile 25% (IQ1) | 66.4% | 51.0% |
| Interquartile 75% (IQ3) | 71.6% | 60.3% |
| Interquartile Range (IQR) | 5.3% | 9.3% |
| Standard Deviation (Sample) | 4.5% | 12.5% |
| Standard Deviation (Population) | 4.5% | 12.4% |
Similar Demographics by In Labor Force | Age > 16
Demographics Similar to Immigrants from El Salvador by In Labor Force | Age > 16
In terms of in labor force | age > 16, the demographic groups most similar to Immigrants from El Salvador are Immigrants from Zimbabwe (66.8%, a difference of 0.0%), Salvadoran (66.8%, a difference of 0.020%), Senegalese (66.7%, a difference of 0.10%), Luxembourger (66.7%, a difference of 0.12%), and Immigrants from Nigeria (66.9%, a difference of 0.17%).
| Demographics | Rating | Rank | In Labor Force | Age > 16 |
| Afghans | 100.0 /100 | #33 | Exceptional 67.1% |
| Immigrants | Ghana | 100.0 /100 | #34 | Exceptional 67.1% |
| Immigrants | South Central Asia | 100.0 /100 | #35 | Exceptional 67.1% |
| Immigrants | Western Africa | 100.0 /100 | #36 | Exceptional 67.1% |
| Immigrants | Afghanistan | 100.0 /100 | #37 | Exceptional 67.0% |
| Immigrants | Nigeria | 100.0 /100 | #38 | Exceptional 66.9% |
| Salvadorans | 100.0 /100 | #39 | Exceptional 66.8% |
| Immigrants | El Salvador | 100.0 /100 | #40 | Exceptional 66.8% |
| Immigrants | Zimbabwe | 100.0 /100 | #41 | Exceptional 66.8% |
| Senegalese | 100.0 /100 | #42 | Exceptional 66.7% |
| Luxembourgers | 100.0 /100 | #43 | Exceptional 66.7% |
| Immigrants | Pakistan | 100.0 /100 | #44 | Exceptional 66.7% |
| Immigrants | Brazil | 100.0 /100 | #45 | Exceptional 66.7% |
| Brazilians | 100.0 /100 | #46 | Exceptional 66.6% |
| Immigrants | Bulgaria | 100.0 /100 | #47 | Exceptional 66.6% |
Demographics Similar to Blackfeet by In Labor Force | Age > 16
In terms of in labor force | age > 16, the demographic groups most similar to Blackfeet are Shoshone (63.2%, a difference of 0.010%), Iroquois (63.2%, a difference of 0.060%), Scotch-Irish (63.3%, a difference of 0.080%), Chippewa (63.1%, a difference of 0.19%), and Pennsylvania German (63.4%, a difference of 0.21%).
| Demographics | Rating | Rank | In Labor Force | Age > 16 |
| Immigrants | Nonimmigrants | 0.0 /100 | #304 | Tragic 63.5% |
| Osage | 0.0 /100 | #305 | Tragic 63.5% |
| Blacks/African Americans | 0.0 /100 | #306 | Tragic 63.4% |
| Central American Indians | 0.0 /100 | #307 | Tragic 63.4% |
| Pennsylvania Germans | 0.0 /100 | #308 | Tragic 63.4% |
| Scotch-Irish | 0.0 /100 | #309 | Tragic 63.3% |
| Shoshone | 0.0 /100 | #310 | Tragic 63.2% |
| Blackfeet | 0.0 /100 | #311 | Tragic 63.2% |
| Iroquois | 0.0 /100 | #312 | Tragic 63.2% |
| Chippewa | 0.0 /100 | #313 | Tragic 63.1% |
| Yaqui | 0.0 /100 | #314 | Tragic 63.0% |
| Potawatomi | 0.0 /100 | #315 | Tragic 62.8% |
| Yup'ik | 0.0 /100 | #316 | Tragic 62.7% |
| Kiowa | 0.0 /100 | #317 | Tragic 62.4% |
| Chickasaw | 0.0 /100 | #318 | Tragic 62.3% |