Immigrants from El Salvador vs Blackfeet 8th Grade
COMPARE
Immigrants from El Salvador
Blackfeet
8th Grade
8th Grade Comparison
Immigrants from El Salvador
Blackfeet
90.3%
8TH GRADE
0.0/ 100
METRIC RATING
345th/ 347
METRIC RANK
96.0%
8TH GRADE
80.8/ 100
METRIC RATING
151st/ 347
METRIC RANK
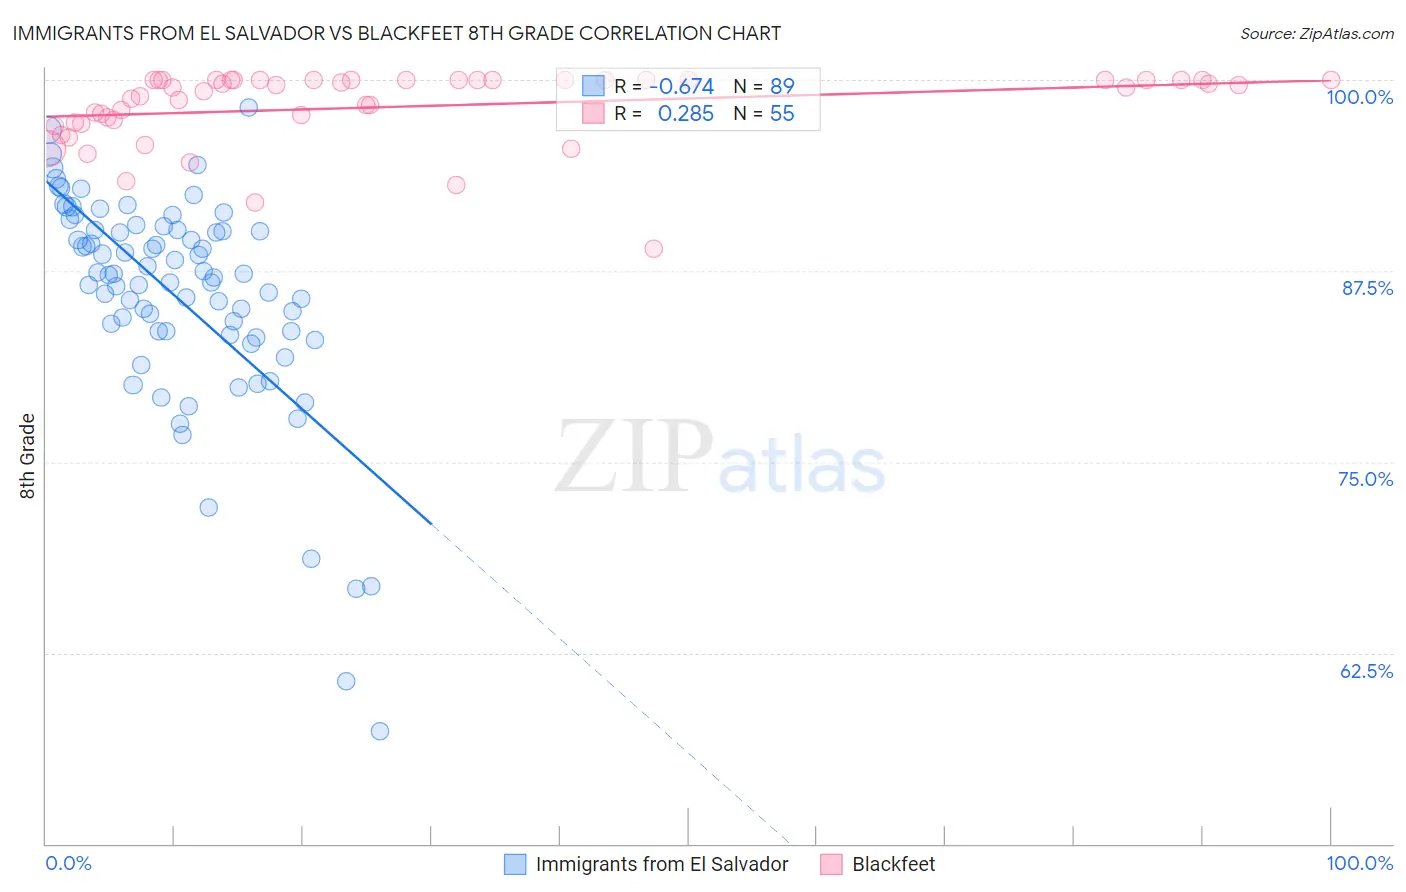
Immigrants from El Salvador vs Blackfeet 8th Grade Correlation Chart
The statistical analysis conducted on geographies consisting of 357,828,194 people shows a significant negative correlation between the proportion of Immigrants from El Salvador and percentage of population with at least 8th grade education in the United States with a correlation coefficient (R) of -0.674 and weighted average of 90.3%. Similarly, the statistical analysis conducted on geographies consisting of 309,580,893 people shows a weak positive correlation between the proportion of Blackfeet and percentage of population with at least 8th grade education in the United States with a correlation coefficient (R) of 0.285 and weighted average of 96.0%, a difference of 6.2%.
8th Grade Correlation Summary
| Measurement | Immigrants from El Salvador | Blackfeet |
| Minimum | 57.3% | 88.9% |
| Maximum | 98.2% | 100.0% |
| Range | 40.9% | 11.1% |
| Mean | 85.8% | 98.3% |
| Median | 87.2% | 99.5% |
| Interquartile 25% (IQ1) | 83.5% | 97.2% |
| Interquartile 75% (IQ3) | 90.2% | 100.0% |
| Interquartile Range (IQR) | 6.7% | 2.8% |
| Standard Deviation (Sample) | 7.2% | 2.4% |
| Standard Deviation (Population) | 7.2% | 2.4% |
Similar Demographics by 8th Grade
Demographics Similar to Immigrants from El Salvador by 8th Grade
In terms of 8th grade, the demographic groups most similar to Immigrants from El Salvador are Immigrants from Central America (90.4%, a difference of 0.090%), Immigrants from Mexico (90.2%, a difference of 0.18%), Immigrants from Guatemala (90.7%, a difference of 0.46%), Salvadoran (90.9%, a difference of 0.62%), and Spanish American Indian (89.8%, a difference of 0.62%).
| Demographics | Rating | Rank | 8th Grade |
| Hispanics or Latinos | 0.0 /100 | #333 | Tragic 92.2% |
| Immigrants | Yemen | 0.0 /100 | #334 | Tragic 92.1% |
| Mexican American Indians | 0.0 /100 | #335 | Tragic 92.1% |
| Immigrants | Honduras | 0.0 /100 | #336 | Tragic 91.9% |
| Immigrants | Latin America | 0.0 /100 | #337 | Tragic 91.7% |
| Central Americans | 0.0 /100 | #338 | Tragic 91.6% |
| Mexicans | 0.0 /100 | #339 | Tragic 91.4% |
| Yakama | 0.0 /100 | #340 | Tragic 91.2% |
| Guatemalans | 0.0 /100 | #341 | Tragic 91.1% |
| Salvadorans | 0.0 /100 | #342 | Tragic 90.9% |
| Immigrants | Guatemala | 0.0 /100 | #343 | Tragic 90.7% |
| Immigrants | Central America | 0.0 /100 | #344 | Tragic 90.4% |
| Immigrants | El Salvador | 0.0 /100 | #345 | Tragic 90.3% |
| Immigrants | Mexico | 0.0 /100 | #346 | Tragic 90.2% |
| Spanish American Indians | 0.0 /100 | #347 | Tragic 89.8% |
Demographics Similar to Blackfeet by 8th Grade
In terms of 8th grade, the demographic groups most similar to Blackfeet are Immigrants from Russia (96.0%, a difference of 0.0%), French American Indian (96.0%, a difference of 0.0%), Immigrants from Israel (96.0%, a difference of 0.010%), Immigrants from Jordan (95.9%, a difference of 0.010%), and Hopi (95.9%, a difference of 0.010%).
| Demographics | Rating | Rank | 8th Grade |
| Immigrants | Belarus | 84.8 /100 | #144 | Excellent 96.0% |
| Lumbee | 84.1 /100 | #145 | Excellent 96.0% |
| Israelis | 84.1 /100 | #146 | Excellent 96.0% |
| Colville | 84.0 /100 | #147 | Excellent 96.0% |
| Albanians | 83.1 /100 | #148 | Excellent 96.0% |
| Immigrants | Israel | 81.3 /100 | #149 | Excellent 96.0% |
| Immigrants | Russia | 80.9 /100 | #150 | Excellent 96.0% |
| Blackfeet | 80.8 /100 | #151 | Excellent 96.0% |
| French American Indians | 80.6 /100 | #152 | Excellent 96.0% |
| Immigrants | Jordan | 79.5 /100 | #153 | Good 95.9% |
| Hopi | 79.4 /100 | #154 | Good 95.9% |
| Kenyans | 74.5 /100 | #155 | Good 95.9% |
| Ugandans | 74.1 /100 | #156 | Good 95.9% |
| Immigrants | Taiwan | 70.5 /100 | #157 | Good 95.9% |
| Arabs | 69.4 /100 | #158 | Good 95.9% |