Immigrants from Ecuador vs Yup'ik In Labor Force | Age 35-44
COMPARE
Immigrants from Ecuador
Yup'ik
In Labor Force | Age 35-44
In Labor Force | Age 35-44 Comparison
Immigrants from Ecuador
Yup'ik
84.1%
IN LABOR FORCE | AGE 35-44
15.2/ 100
METRIC RATING
211th/ 347
METRIC RANK
77.3%
IN LABOR FORCE | AGE 35-44
0.0/ 100
METRIC RATING
339th/ 347
METRIC RANK
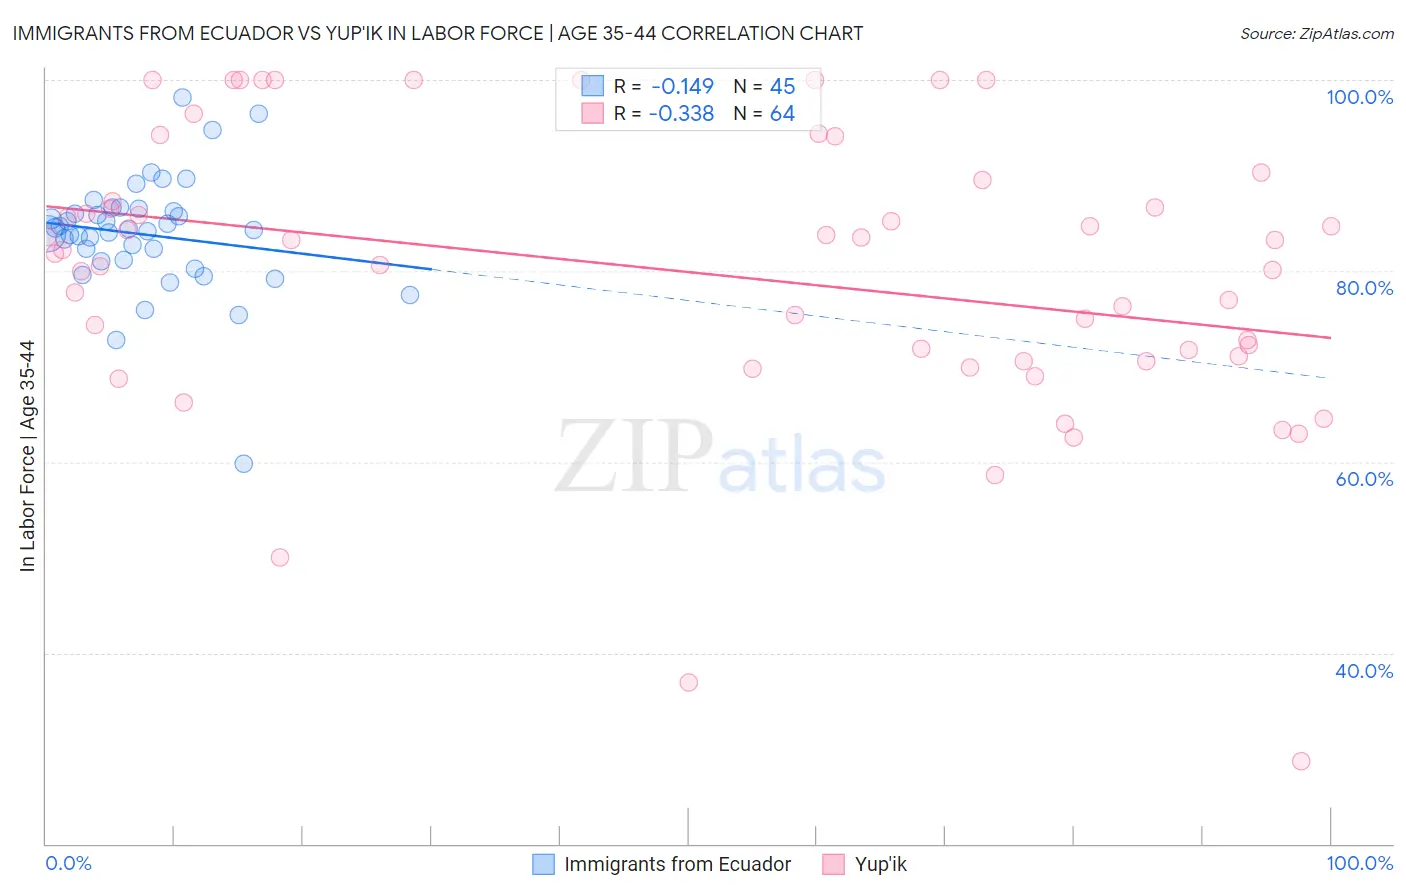
Immigrants from Ecuador vs Yup'ik In Labor Force | Age 35-44 Correlation Chart
The statistical analysis conducted on geographies consisting of 270,930,816 people shows a poor negative correlation between the proportion of Immigrants from Ecuador and labor force participation rate among population between the ages 35 and 44 in the United States with a correlation coefficient (R) of -0.149 and weighted average of 84.1%. Similarly, the statistical analysis conducted on geographies consisting of 39,956,456 people shows a mild negative correlation between the proportion of Yup'ik and labor force participation rate among population between the ages 35 and 44 in the United States with a correlation coefficient (R) of -0.338 and weighted average of 77.3%, a difference of 8.9%.
In Labor Force | Age 35-44 Correlation Summary
| Measurement | Immigrants from Ecuador | Yup'ik |
| Minimum | 59.8% | 28.6% |
| Maximum | 98.2% | 100.0% |
| Range | 38.4% | 71.4% |
| Mean | 83.8% | 79.8% |
| Median | 84.3% | 82.0% |
| Interquartile 25% (IQ1) | 81.1% | 70.8% |
| Interquartile 75% (IQ3) | 86.4% | 88.4% |
| Interquartile Range (IQR) | 5.4% | 17.6% |
| Standard Deviation (Sample) | 6.2% | 14.9% |
| Standard Deviation (Population) | 6.1% | 14.8% |
Similar Demographics by In Labor Force | Age 35-44
Demographics Similar to Immigrants from Ecuador by In Labor Force | Age 35-44
In terms of in labor force | age 35-44, the demographic groups most similar to Immigrants from Ecuador are New Zealander (84.1%, a difference of 0.010%), Israeli (84.1%, a difference of 0.010%), Bangladeshi (84.1%, a difference of 0.020%), Immigrants from North America (84.2%, a difference of 0.030%), and Swiss (84.2%, a difference of 0.030%).
| Demographics | Rating | Rank | In Labor Force | Age 35-44 |
| Canadians | 19.9 /100 | #204 | Poor 84.2% |
| Immigrants | Canada | 19.6 /100 | #205 | Poor 84.2% |
| Immigrants | Costa Rica | 19.5 /100 | #206 | Poor 84.2% |
| Laotians | 19.0 /100 | #207 | Poor 84.2% |
| Immigrants | North America | 18.1 /100 | #208 | Poor 84.2% |
| Swiss | 17.4 /100 | #209 | Poor 84.2% |
| New Zealanders | 16.2 /100 | #210 | Poor 84.1% |
| Immigrants | Ecuador | 15.2 /100 | #211 | Poor 84.1% |
| Israelis | 14.0 /100 | #212 | Poor 84.1% |
| Bangladeshis | 13.7 /100 | #213 | Poor 84.1% |
| Immigrants | Barbados | 13.2 /100 | #214 | Poor 84.1% |
| Europeans | 12.2 /100 | #215 | Poor 84.1% |
| Nicaraguans | 12.1 /100 | #216 | Poor 84.1% |
| Immigrants | Norway | 11.7 /100 | #217 | Poor 84.1% |
| Immigrants | Nicaragua | 9.4 /100 | #218 | Tragic 84.1% |
Demographics Similar to Yup'ik by In Labor Force | Age 35-44
In terms of in labor force | age 35-44, the demographic groups most similar to Yup'ik are Pueblo (77.4%, a difference of 0.10%), Lumbee (77.0%, a difference of 0.35%), Hopi (77.0%, a difference of 0.40%), Apache (77.9%, a difference of 0.81%), and Arapaho (78.1%, a difference of 1.0%).
| Demographics | Rating | Rank | In Labor Force | Age 35-44 |
| Ute | 0.0 /100 | #332 | Tragic 79.4% |
| Kiowa | 0.0 /100 | #333 | Tragic 79.2% |
| Yakama | 0.0 /100 | #334 | Tragic 79.0% |
| Natives/Alaskans | 0.0 /100 | #335 | Tragic 78.9% |
| Arapaho | 0.0 /100 | #336 | Tragic 78.1% |
| Apache | 0.0 /100 | #337 | Tragic 77.9% |
| Pueblo | 0.0 /100 | #338 | Tragic 77.4% |
| Yup'ik | 0.0 /100 | #339 | Tragic 77.3% |
| Lumbee | 0.0 /100 | #340 | Tragic 77.0% |
| Hopi | 0.0 /100 | #341 | Tragic 77.0% |
| Crow | 0.0 /100 | #342 | Tragic 76.5% |
| Immigrants | Yemen | 0.0 /100 | #343 | Tragic 76.3% |
| Pima | 0.0 /100 | #344 | Tragic 74.8% |
| Yuman | 0.0 /100 | #345 | Tragic 74.7% |
| Tohono O'odham | 0.0 /100 | #346 | Tragic 74.1% |