Immigrants from Eastern Europe vs Immigrants from Egypt In Labor Force | Age 35-44
COMPARE
Immigrants from Eastern Europe
Immigrants from Egypt
In Labor Force | Age 35-44
In Labor Force | Age 35-44 Comparison
Immigrants from Eastern Europe
Immigrants from Egypt
84.9%
IN LABOR FORCE | AGE 35-44
98.3/ 100
METRIC RATING
81st/ 347
METRIC RANK
84.7%
IN LABOR FORCE | AGE 35-44
92.7/ 100
METRIC RATING
116th/ 347
METRIC RANK
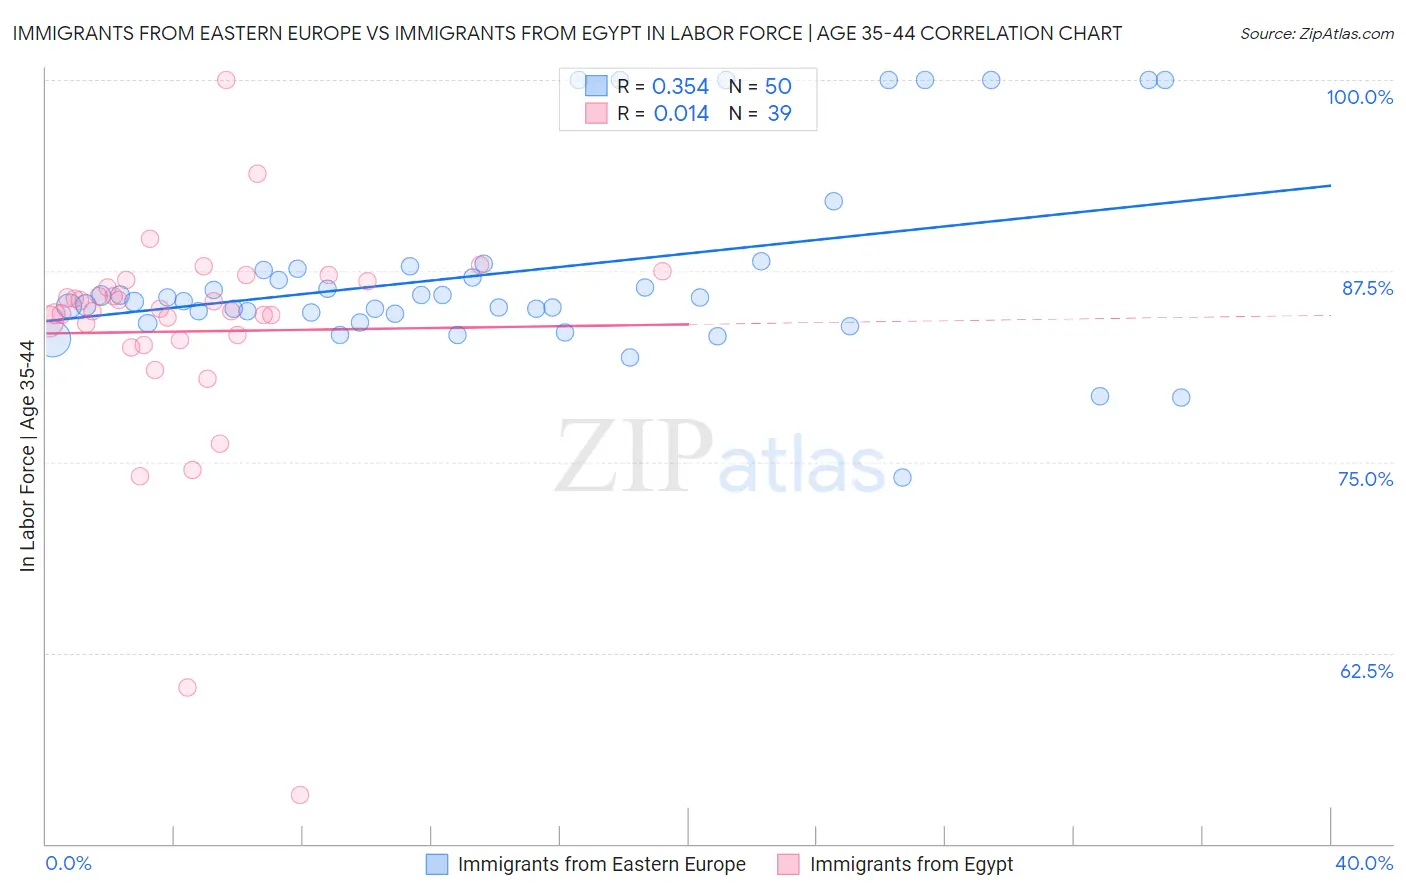
Immigrants from Eastern Europe vs Immigrants from Egypt In Labor Force | Age 35-44 Correlation Chart
The statistical analysis conducted on geographies consisting of 475,561,488 people shows a mild positive correlation between the proportion of Immigrants from Eastern Europe and labor force participation rate among population between the ages 35 and 44 in the United States with a correlation coefficient (R) of 0.354 and weighted average of 84.9%. Similarly, the statistical analysis conducted on geographies consisting of 245,437,423 people shows no correlation between the proportion of Immigrants from Egypt and labor force participation rate among population between the ages 35 and 44 in the United States with a correlation coefficient (R) of 0.014 and weighted average of 84.7%, a difference of 0.24%.
In Labor Force | Age 35-44 Correlation Summary
| Measurement | Immigrants from Eastern Europe | Immigrants from Egypt |
| Minimum | 74.0% | 53.2% |
| Maximum | 100.0% | 100.0% |
| Range | 26.0% | 46.8% |
| Mean | 87.4% | 83.5% |
| Median | 85.6% | 84.9% |
| Interquartile 25% (IQ1) | 84.7% | 83.0% |
| Interquartile 75% (IQ3) | 87.6% | 86.8% |
| Interquartile Range (IQR) | 2.9% | 3.8% |
| Standard Deviation (Sample) | 6.1% | 7.7% |
| Standard Deviation (Population) | 6.1% | 7.6% |
Similar Demographics by In Labor Force | Age 35-44
Demographics Similar to Immigrants from Eastern Europe by In Labor Force | Age 35-44
In terms of in labor force | age 35-44, the demographic groups most similar to Immigrants from Eastern Europe are Peruvian (84.9%, a difference of 0.0%), Immigrants from Colombia (84.9%, a difference of 0.0%), Immigrants from Africa (84.9%, a difference of 0.010%), Immigrants from Sudan (84.9%, a difference of 0.020%), and Immigrants from Turkey (84.9%, a difference of 0.030%).
| Demographics | Rating | Rank | In Labor Force | Age 35-44 |
| Colombians | 98.8 /100 | #74 | Exceptional 85.0% |
| Immigrants | South Central Asia | 98.7 /100 | #75 | Exceptional 85.0% |
| Immigrants | Cuba | 98.6 /100 | #76 | Exceptional 84.9% |
| Immigrants | Turkey | 98.6 /100 | #77 | Exceptional 84.9% |
| Immigrants | Africa | 98.4 /100 | #78 | Exceptional 84.9% |
| Peruvians | 98.3 /100 | #79 | Exceptional 84.9% |
| Immigrants | Colombia | 98.3 /100 | #80 | Exceptional 84.9% |
| Immigrants | Eastern Europe | 98.3 /100 | #81 | Exceptional 84.9% |
| Immigrants | Sudan | 98.1 /100 | #82 | Exceptional 84.9% |
| Senegalese | 97.8 /100 | #83 | Exceptional 84.9% |
| Immigrants | Peru | 97.8 /100 | #84 | Exceptional 84.9% |
| Immigrants | Middle Africa | 97.8 /100 | #85 | Exceptional 84.9% |
| Greeks | 97.8 /100 | #86 | Exceptional 84.9% |
| Belgians | 97.7 /100 | #87 | Exceptional 84.9% |
| Yugoslavians | 97.7 /100 | #88 | Exceptional 84.9% |
Demographics Similar to Immigrants from Egypt by In Labor Force | Age 35-44
In terms of in labor force | age 35-44, the demographic groups most similar to Immigrants from Egypt are Uruguayan (84.7%, a difference of 0.010%), Chilean (84.7%, a difference of 0.010%), Bahamian (84.7%, a difference of 0.010%), Immigrants from China (84.7%, a difference of 0.010%), and Immigrants from Eastern Asia (84.7%, a difference of 0.010%).
| Demographics | Rating | Rank | In Labor Force | Age 35-44 |
| Immigrants | Russia | 94.5 /100 | #109 | Exceptional 84.8% |
| Filipinos | 93.8 /100 | #110 | Exceptional 84.7% |
| Ukrainians | 93.5 /100 | #111 | Exceptional 84.7% |
| Immigrants | Western Africa | 93.4 /100 | #112 | Exceptional 84.7% |
| Uruguayans | 93.3 /100 | #113 | Exceptional 84.7% |
| Chileans | 93.2 /100 | #114 | Exceptional 84.7% |
| Bahamians | 93.2 /100 | #115 | Exceptional 84.7% |
| Immigrants | Egypt | 92.7 /100 | #116 | Exceptional 84.7% |
| Immigrants | China | 92.3 /100 | #117 | Exceptional 84.7% |
| Immigrants | Eastern Asia | 92.1 /100 | #118 | Exceptional 84.7% |
| Burmese | 91.8 /100 | #119 | Exceptional 84.7% |
| Immigrants | Northern Europe | 91.5 /100 | #120 | Exceptional 84.7% |
| Finns | 91.2 /100 | #121 | Exceptional 84.7% |
| Germans | 91.0 /100 | #122 | Exceptional 84.7% |
| Immigrants | South America | 90.9 /100 | #123 | Exceptional 84.7% |