Immigrants from Eastern Asia vs Welsh Divorced or Separated
COMPARE
Immigrants from Eastern Asia
Welsh
Divorced or Separated
Divorced or Separated Comparison
Immigrants from Eastern Asia
Welsh
10.2%
DIVORCED OR SEPARATED
100.0/ 100
METRIC RATING
8th/ 347
METRIC RANK
12.6%
DIVORCED OR SEPARATED
0.7/ 100
METRIC RATING
255th/ 347
METRIC RANK
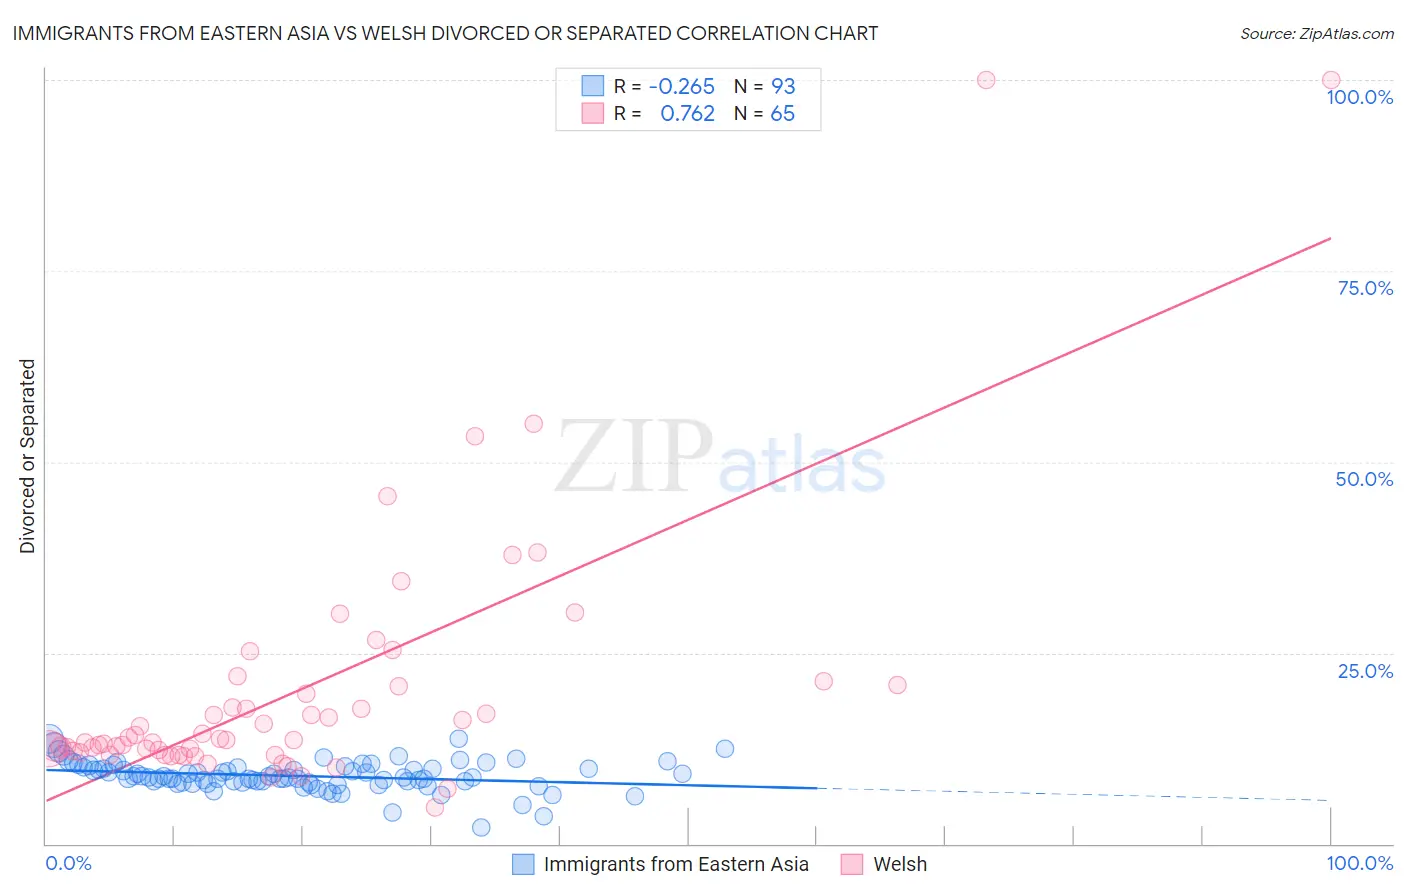
Immigrants from Eastern Asia vs Welsh Divorced or Separated Correlation Chart
The statistical analysis conducted on geographies consisting of 499,533,404 people shows a weak negative correlation between the proportion of Immigrants from Eastern Asia and percentage of population currently divorced or separated in the United States with a correlation coefficient (R) of -0.265 and weighted average of 10.2%. Similarly, the statistical analysis conducted on geographies consisting of 528,296,815 people shows a strong positive correlation between the proportion of Welsh and percentage of population currently divorced or separated in the United States with a correlation coefficient (R) of 0.762 and weighted average of 12.6%, a difference of 22.8%.
Divorced or Separated Correlation Summary
| Measurement | Immigrants from Eastern Asia | Welsh |
| Minimum | 2.2% | 4.7% |
| Maximum | 13.7% | 100.0% |
| Range | 11.5% | 95.3% |
| Mean | 8.9% | 20.2% |
| Median | 8.7% | 13.5% |
| Interquartile 25% (IQ1) | 8.1% | 12.1% |
| Interquartile 75% (IQ3) | 9.9% | 20.7% |
| Interquartile Range (IQR) | 1.8% | 8.6% |
| Standard Deviation (Sample) | 1.9% | 17.5% |
| Standard Deviation (Population) | 1.9% | 17.4% |
Similar Demographics by Divorced or Separated
Demographics Similar to Immigrants from Eastern Asia by Divorced or Separated
In terms of divorced or separated, the demographic groups most similar to Immigrants from Eastern Asia are Thai (10.2%, a difference of 0.34%), Indian (Asian) (10.2%, a difference of 0.39%), Yup'ik (10.3%, a difference of 0.44%), Immigrants from Singapore (10.3%, a difference of 0.97%), and Immigrants from India (10.1%, a difference of 1.7%).
| Demographics | Rating | Rank | Divorced or Separated |
| Immigrants | Taiwan | 100.0 /100 | #1 | Exceptional 9.8% |
| Filipinos | 100.0 /100 | #2 | Exceptional 9.9% |
| Immigrants | Hong Kong | 100.0 /100 | #3 | Exceptional 10.0% |
| Immigrants | China | 100.0 /100 | #4 | Exceptional 10.0% |
| Immigrants | India | 100.0 /100 | #5 | Exceptional 10.1% |
| Indians (Asian) | 100.0 /100 | #6 | Exceptional 10.2% |
| Thais | 100.0 /100 | #7 | Exceptional 10.2% |
| Immigrants | Eastern Asia | 100.0 /100 | #8 | Exceptional 10.2% |
| Yup'ik | 100.0 /100 | #9 | Exceptional 10.3% |
| Immigrants | Singapore | 100.0 /100 | #10 | Exceptional 10.3% |
| Immigrants | South Central Asia | 100.0 /100 | #11 | Exceptional 10.4% |
| Okinawans | 100.0 /100 | #12 | Exceptional 10.5% |
| Cypriots | 100.0 /100 | #13 | Exceptional 10.5% |
| Assyrians/Chaldeans/Syriacs | 100.0 /100 | #14 | Exceptional 10.6% |
| Immigrants | Armenia | 100.0 /100 | #15 | Exceptional 10.6% |
Demographics Similar to Welsh by Divorced or Separated
In terms of divorced or separated, the demographic groups most similar to Welsh are Senegalese (12.6%, a difference of 0.10%), Liberian (12.6%, a difference of 0.16%), Somali (12.6%, a difference of 0.16%), Immigrants from Colombia (12.6%, a difference of 0.16%), and Immigrants from Somalia (12.6%, a difference of 0.17%).
| Demographics | Rating | Rank | Divorced or Separated |
| Nepalese | 1.8 /100 | #248 | Tragic 12.5% |
| Finns | 1.8 /100 | #249 | Tragic 12.5% |
| Irish | 1.3 /100 | #250 | Tragic 12.5% |
| Aleuts | 1.3 /100 | #251 | Tragic 12.5% |
| Liberians | 0.9 /100 | #252 | Tragic 12.6% |
| Somalis | 0.9 /100 | #253 | Tragic 12.6% |
| Senegalese | 0.8 /100 | #254 | Tragic 12.6% |
| Welsh | 0.7 /100 | #255 | Tragic 12.6% |
| Immigrants | Colombia | 0.6 /100 | #256 | Tragic 12.6% |
| Immigrants | Somalia | 0.6 /100 | #257 | Tragic 12.6% |
| Indonesians | 0.6 /100 | #258 | Tragic 12.6% |
| Yuman | 0.6 /100 | #259 | Tragic 12.6% |
| Immigrants | Uruguay | 0.6 /100 | #260 | Tragic 12.6% |
| Immigrants | Dominica | 0.5 /100 | #261 | Tragic 12.6% |
| Basques | 0.5 /100 | #262 | Tragic 12.6% |