Immigrants from Eastern Asia vs Immigrants from Spain In Labor Force | Age 20-24
COMPARE
Immigrants from Eastern Asia
Immigrants from Spain
In Labor Force | Age 20-24
In Labor Force | Age 20-24 Comparison
Immigrants from Eastern Asia
Immigrants from Spain
71.8%
IN LABOR FORCE | AGE 20-24
0.0/ 100
METRIC RATING
316th/ 347
METRIC RANK
73.2%
IN LABOR FORCE | AGE 20-24
0.1/ 100
METRIC RATING
282nd/ 347
METRIC RANK
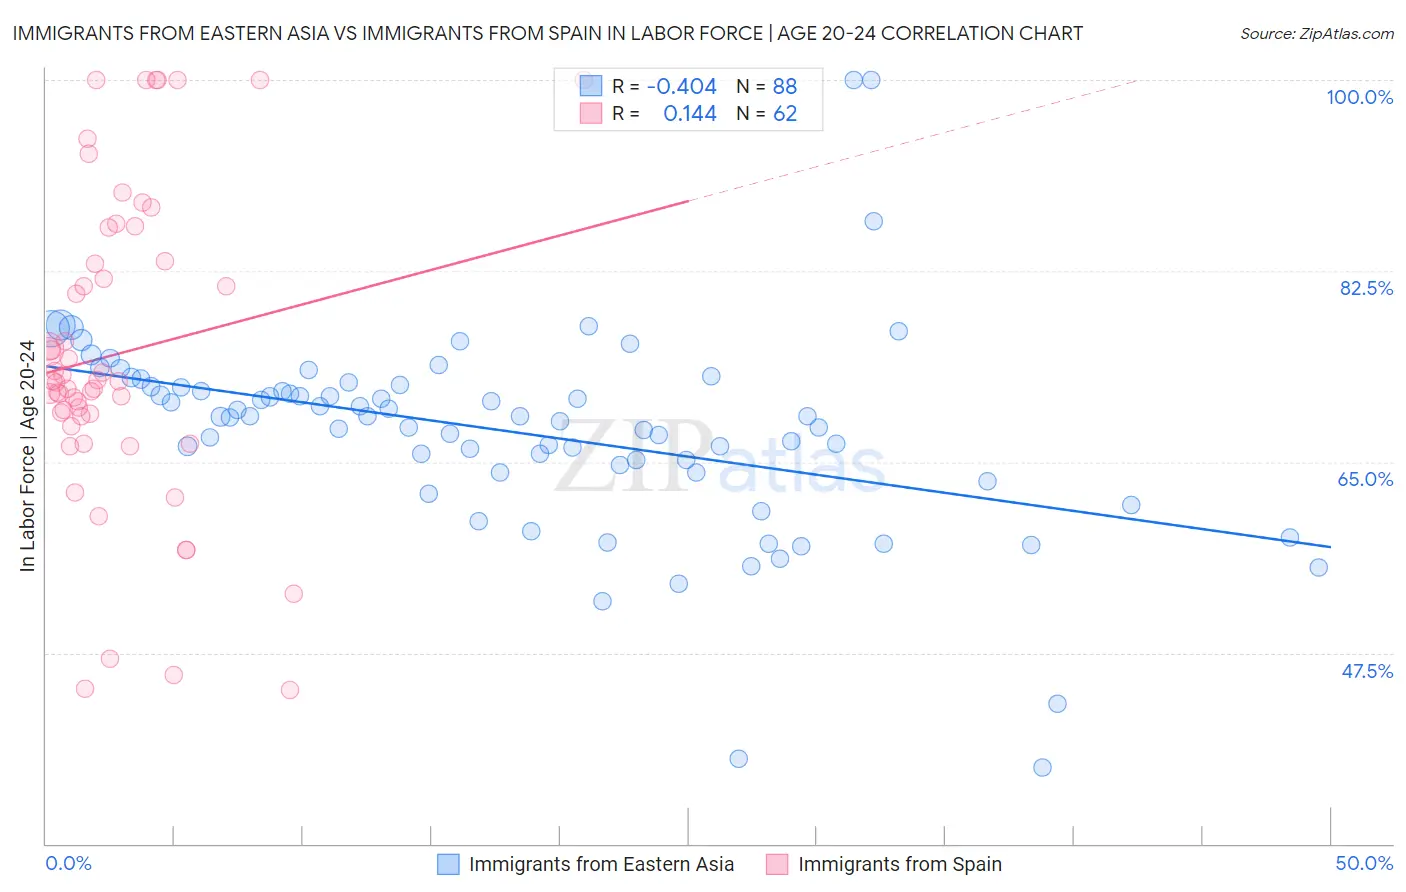
Immigrants from Eastern Asia vs Immigrants from Spain In Labor Force | Age 20-24 Correlation Chart
The statistical analysis conducted on geographies consisting of 499,591,558 people shows a moderate negative correlation between the proportion of Immigrants from Eastern Asia and labor force participation rate among population between the ages 20 and 24 in the United States with a correlation coefficient (R) of -0.404 and weighted average of 71.8%. Similarly, the statistical analysis conducted on geographies consisting of 239,648,988 people shows a poor positive correlation between the proportion of Immigrants from Spain and labor force participation rate among population between the ages 20 and 24 in the United States with a correlation coefficient (R) of 0.144 and weighted average of 73.2%, a difference of 2.0%.
In Labor Force | Age 20-24 Correlation Summary
| Measurement | Immigrants from Eastern Asia | Immigrants from Spain |
| Minimum | 37.0% | 44.1% |
| Maximum | 100.0% | 100.0% |
| Range | 63.0% | 55.9% |
| Mean | 67.7% | 74.9% |
| Median | 69.1% | 72.4% |
| Interquartile 25% (IQ1) | 64.3% | 69.2% |
| Interquartile 75% (IQ3) | 72.0% | 83.4% |
| Interquartile Range (IQR) | 7.6% | 14.2% |
| Standard Deviation (Sample) | 9.6% | 14.2% |
| Standard Deviation (Population) | 9.5% | 14.1% |
Similar Demographics by In Labor Force | Age 20-24
Demographics Similar to Immigrants from Eastern Asia by In Labor Force | Age 20-24
In terms of in labor force | age 20-24, the demographic groups most similar to Immigrants from Eastern Asia are Immigrants from Iran (71.8%, a difference of 0.040%), Indian (Asian) (71.9%, a difference of 0.13%), Immigrants from Dominica (71.9%, a difference of 0.14%), Immigrants from Armenia (71.7%, a difference of 0.17%), and Immigrants from Caribbean (71.9%, a difference of 0.19%).
| Demographics | Rating | Rank | In Labor Force | Age 20-24 |
| Tsimshian | 0.0 /100 | #309 | Tragic 72.3% |
| Immigrants | Cuba | 0.0 /100 | #310 | Tragic 72.0% |
| Apache | 0.0 /100 | #311 | Tragic 72.0% |
| Immigrants | Caribbean | 0.0 /100 | #312 | Tragic 71.9% |
| Immigrants | Dominica | 0.0 /100 | #313 | Tragic 71.9% |
| Indians (Asian) | 0.0 /100 | #314 | Tragic 71.9% |
| Immigrants | Iran | 0.0 /100 | #315 | Tragic 71.8% |
| Immigrants | Eastern Asia | 0.0 /100 | #316 | Tragic 71.8% |
| Immigrants | Armenia | 0.0 /100 | #317 | Tragic 71.7% |
| Immigrants | Hong Kong | 0.0 /100 | #318 | Tragic 71.6% |
| Immigrants | Israel | 0.0 /100 | #319 | Tragic 71.6% |
| Trinidadians and Tobagonians | 0.0 /100 | #320 | Tragic 71.5% |
| Immigrants | Taiwan | 0.0 /100 | #321 | Tragic 71.5% |
| Filipinos | 0.0 /100 | #322 | Tragic 71.4% |
| West Indians | 0.0 /100 | #323 | Tragic 71.3% |
Demographics Similar to Immigrants from Spain by In Labor Force | Age 20-24
In terms of in labor force | age 20-24, the demographic groups most similar to Immigrants from Spain are Immigrants from Venezuela (73.2%, a difference of 0.010%), Immigrants from Bahamas (73.2%, a difference of 0.010%), Kiowa (73.2%, a difference of 0.030%), Bahamian (73.3%, a difference of 0.040%), and Nicaraguan (73.2%, a difference of 0.090%).
| Demographics | Rating | Rank | In Labor Force | Age 20-24 |
| Immigrants | South America | 0.2 /100 | #275 | Tragic 73.3% |
| Mongolians | 0.2 /100 | #276 | Tragic 73.3% |
| Immigrants | Malaysia | 0.2 /100 | #277 | Tragic 73.3% |
| Cypriots | 0.2 /100 | #278 | Tragic 73.3% |
| Venezuelans | 0.2 /100 | #279 | Tragic 73.3% |
| Bahamians | 0.1 /100 | #280 | Tragic 73.3% |
| Immigrants | Venezuela | 0.1 /100 | #281 | Tragic 73.2% |
| Immigrants | Spain | 0.1 /100 | #282 | Tragic 73.2% |
| Immigrants | Bahamas | 0.1 /100 | #283 | Tragic 73.2% |
| Kiowa | 0.1 /100 | #284 | Tragic 73.2% |
| Nicaraguans | 0.1 /100 | #285 | Tragic 73.2% |
| Immigrants | Lebanon | 0.1 /100 | #286 | Tragic 73.1% |
| Immigrants | Korea | 0.1 /100 | #287 | Tragic 73.1% |
| Argentineans | 0.1 /100 | #288 | Tragic 73.1% |
| U.S. Virgin Islanders | 0.1 /100 | #289 | Tragic 73.0% |