Immigrants from Eastern Asia vs Filipino In Labor Force | Age 20-24
COMPARE
Immigrants from Eastern Asia
Filipino
In Labor Force | Age 20-24
In Labor Force | Age 20-24 Comparison
Immigrants from Eastern Asia
Filipinos
71.8%
IN LABOR FORCE | AGE 20-24
0.0/ 100
METRIC RATING
316th/ 347
METRIC RANK
71.4%
IN LABOR FORCE | AGE 20-24
0.0/ 100
METRIC RATING
322nd/ 347
METRIC RANK
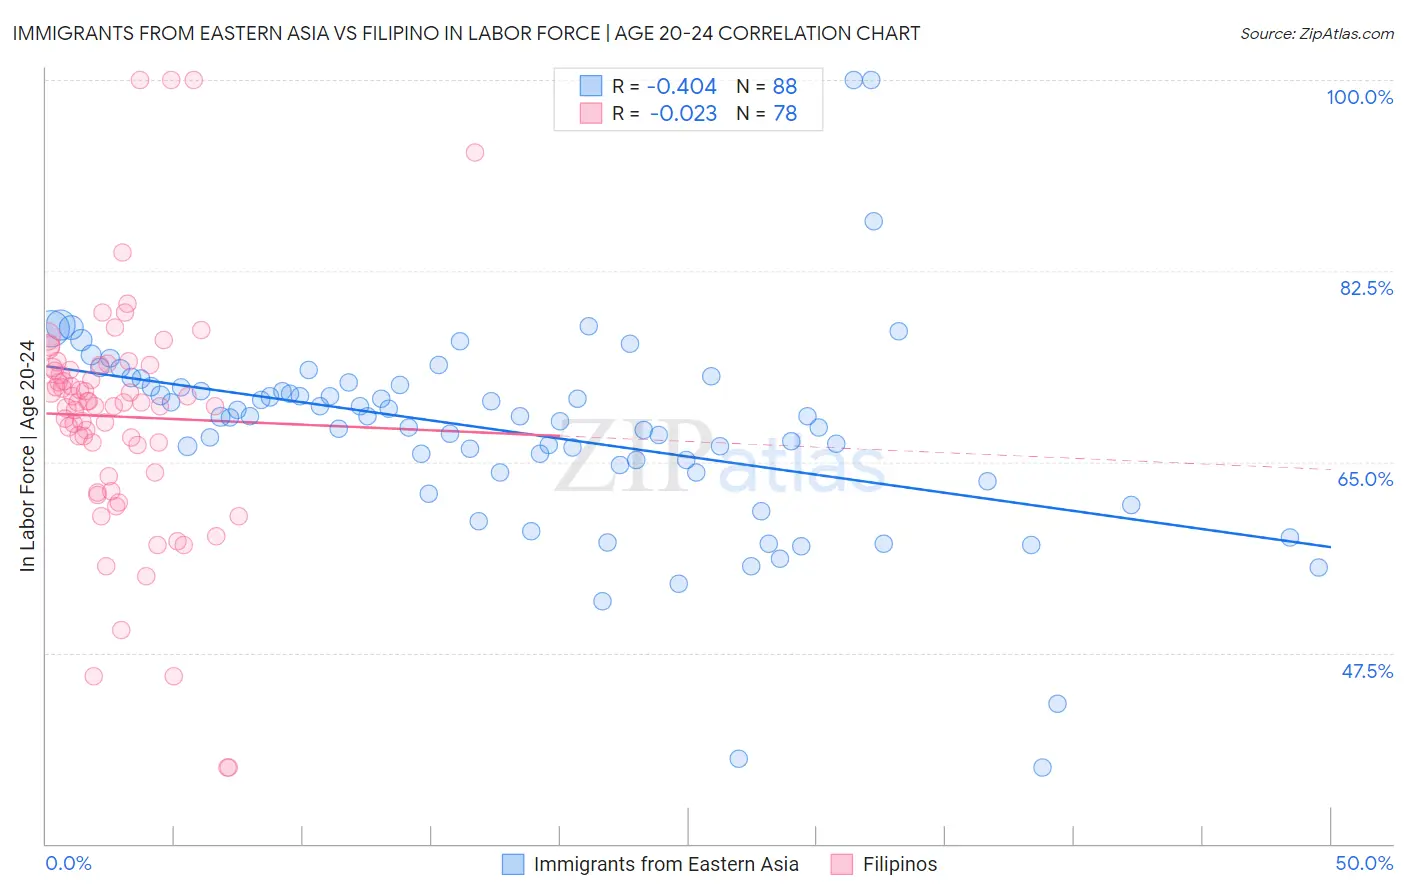
Immigrants from Eastern Asia vs Filipino In Labor Force | Age 20-24 Correlation Chart
The statistical analysis conducted on geographies consisting of 499,591,558 people shows a moderate negative correlation between the proportion of Immigrants from Eastern Asia and labor force participation rate among population between the ages 20 and 24 in the United States with a correlation coefficient (R) of -0.404 and weighted average of 71.8%. Similarly, the statistical analysis conducted on geographies consisting of 254,292,244 people shows no correlation between the proportion of Filipinos and labor force participation rate among population between the ages 20 and 24 in the United States with a correlation coefficient (R) of -0.023 and weighted average of 71.4%, a difference of 0.54%.
In Labor Force | Age 20-24 Correlation Summary
| Measurement | Immigrants from Eastern Asia | Filipino |
| Minimum | 37.0% | 37.0% |
| Maximum | 100.0% | 100.0% |
| Range | 63.0% | 63.0% |
| Mean | 67.7% | 69.1% |
| Median | 69.1% | 70.4% |
| Interquartile 25% (IQ1) | 64.3% | 64.0% |
| Interquartile 75% (IQ3) | 72.0% | 73.6% |
| Interquartile Range (IQR) | 7.6% | 9.6% |
| Standard Deviation (Sample) | 9.6% | 11.2% |
| Standard Deviation (Population) | 9.5% | 11.1% |
Demographics Similar to Immigrants from Eastern Asia and Filipinos by In Labor Force | Age 20-24
In terms of in labor force | age 20-24, the demographic groups most similar to Immigrants from Eastern Asia are Immigrants from Iran (71.8%, a difference of 0.040%), Indian (Asian) (71.9%, a difference of 0.13%), Immigrants from Dominica (71.9%, a difference of 0.14%), Immigrants from Armenia (71.7%, a difference of 0.17%), and Immigrants from Caribbean (71.9%, a difference of 0.19%). Similarly, the demographic groups most similar to Filipinos are Immigrants from Taiwan (71.5%, a difference of 0.13%), Trinidadian and Tobagonian (71.5%, a difference of 0.18%), West Indian (71.3%, a difference of 0.18%), Immigrants from Israel (71.6%, a difference of 0.26%), and Immigrants from Dominican Republic (71.2%, a difference of 0.27%).
| Demographics | Rating | Rank | In Labor Force | Age 20-24 |
| Tsimshian | 0.0 /100 | #309 | Tragic 72.3% |
| Immigrants | Cuba | 0.0 /100 | #310 | Tragic 72.0% |
| Apache | 0.0 /100 | #311 | Tragic 72.0% |
| Immigrants | Caribbean | 0.0 /100 | #312 | Tragic 71.9% |
| Immigrants | Dominica | 0.0 /100 | #313 | Tragic 71.9% |
| Indians (Asian) | 0.0 /100 | #314 | Tragic 71.9% |
| Immigrants | Iran | 0.0 /100 | #315 | Tragic 71.8% |
| Immigrants | Eastern Asia | 0.0 /100 | #316 | Tragic 71.8% |
| Immigrants | Armenia | 0.0 /100 | #317 | Tragic 71.7% |
| Immigrants | Hong Kong | 0.0 /100 | #318 | Tragic 71.6% |
| Immigrants | Israel | 0.0 /100 | #319 | Tragic 71.6% |
| Trinidadians and Tobagonians | 0.0 /100 | #320 | Tragic 71.5% |
| Immigrants | Taiwan | 0.0 /100 | #321 | Tragic 71.5% |
| Filipinos | 0.0 /100 | #322 | Tragic 71.4% |
| West Indians | 0.0 /100 | #323 | Tragic 71.3% |
| Immigrants | Dominican Republic | 0.0 /100 | #324 | Tragic 71.2% |
| Barbadians | 0.0 /100 | #325 | Tragic 71.1% |
| Dominicans | 0.0 /100 | #326 | Tragic 71.1% |
| Immigrants | Trinidad and Tobago | 0.0 /100 | #327 | Tragic 71.1% |
| Immigrants | China | 0.0 /100 | #328 | Tragic 71.1% |
| Yup'ik | 0.0 /100 | #329 | Tragic 70.9% |