British vs Immigrants from Spain In Labor Force | Age 20-24
COMPARE
British
Immigrants from Spain
In Labor Force | Age 20-24
In Labor Force | Age 20-24 Comparison
British
Immigrants from Spain
76.7%
IN LABOR FORCE | AGE 20-24
99.8/ 100
METRIC RATING
73rd/ 347
METRIC RANK
73.2%
IN LABOR FORCE | AGE 20-24
0.1/ 100
METRIC RATING
282nd/ 347
METRIC RANK
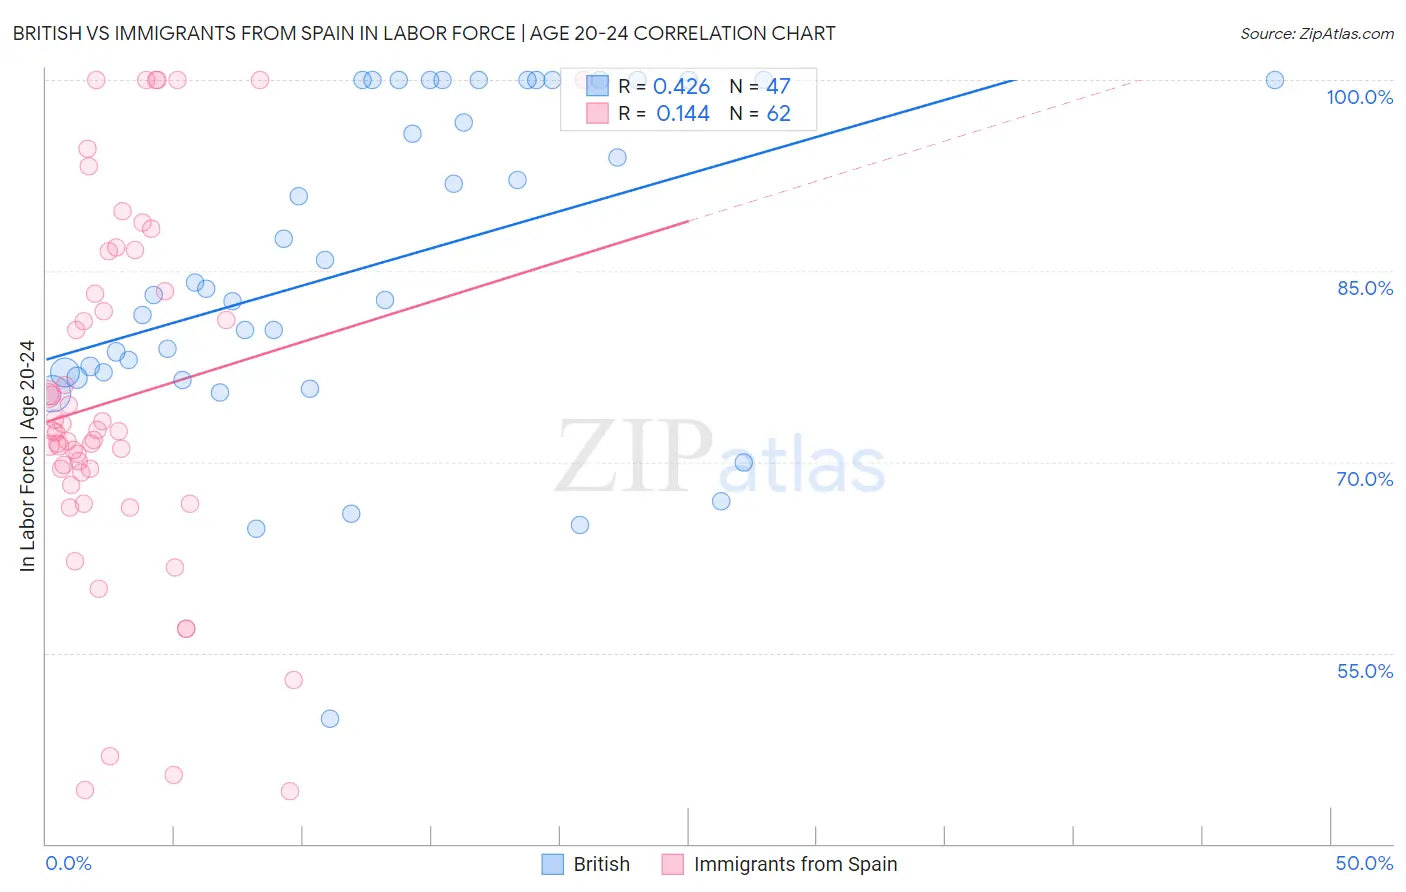
British vs Immigrants from Spain In Labor Force | Age 20-24 Correlation Chart
The statistical analysis conducted on geographies consisting of 530,798,308 people shows a moderate positive correlation between the proportion of British and labor force participation rate among population between the ages 20 and 24 in the United States with a correlation coefficient (R) of 0.426 and weighted average of 76.7%. Similarly, the statistical analysis conducted on geographies consisting of 239,648,988 people shows a poor positive correlation between the proportion of Immigrants from Spain and labor force participation rate among population between the ages 20 and 24 in the United States with a correlation coefficient (R) of 0.144 and weighted average of 73.2%, a difference of 4.7%.
In Labor Force | Age 20-24 Correlation Summary
| Measurement | British | Immigrants from Spain |
| Minimum | 49.8% | 44.1% |
| Maximum | 100.0% | 100.0% |
| Range | 50.2% | 55.9% |
| Mean | 85.6% | 74.9% |
| Median | 83.6% | 72.4% |
| Interquartile 25% (IQ1) | 77.0% | 69.2% |
| Interquartile 75% (IQ3) | 100.0% | 83.4% |
| Interquartile Range (IQR) | 23.0% | 14.2% |
| Standard Deviation (Sample) | 12.7% | 14.2% |
| Standard Deviation (Population) | 12.5% | 14.1% |
Similar Demographics by In Labor Force | Age 20-24
Demographics Similar to British by In Labor Force | Age 20-24
In terms of in labor force | age 20-24, the demographic groups most similar to British are Guamanian/Chamorro (76.7%, a difference of 0.050%), Cree (76.6%, a difference of 0.070%), Northern European (76.8%, a difference of 0.080%), Immigrants from Middle Africa (76.6%, a difference of 0.090%), and Immigrants from Moldova (76.6%, a difference of 0.13%).
| Demographics | Rating | Rank | In Labor Force | Age 20-24 |
| Icelanders | 99.9 /100 | #66 | Exceptional 76.9% |
| Slavs | 99.9 /100 | #67 | Exceptional 76.9% |
| French American Indians | 99.8 /100 | #68 | Exceptional 76.8% |
| Immigrants | Sudan | 99.8 /100 | #69 | Exceptional 76.8% |
| Ottawa | 99.8 /100 | #70 | Exceptional 76.8% |
| Northern Europeans | 99.8 /100 | #71 | Exceptional 76.8% |
| Guamanians/Chamorros | 99.8 /100 | #72 | Exceptional 76.7% |
| British | 99.8 /100 | #73 | Exceptional 76.7% |
| Cree | 99.7 /100 | #74 | Exceptional 76.6% |
| Immigrants | Middle Africa | 99.7 /100 | #75 | Exceptional 76.6% |
| Immigrants | Moldova | 99.6 /100 | #76 | Exceptional 76.6% |
| Immigrants | Cameroon | 99.6 /100 | #77 | Exceptional 76.6% |
| Canadians | 99.6 /100 | #78 | Exceptional 76.6% |
| Immigrants | Zaire | 99.6 /100 | #79 | Exceptional 76.6% |
| Italians | 99.6 /100 | #80 | Exceptional 76.5% |
Demographics Similar to Immigrants from Spain by In Labor Force | Age 20-24
In terms of in labor force | age 20-24, the demographic groups most similar to Immigrants from Spain are Immigrants from Venezuela (73.2%, a difference of 0.010%), Immigrants from Bahamas (73.2%, a difference of 0.010%), Kiowa (73.2%, a difference of 0.030%), Bahamian (73.3%, a difference of 0.040%), and Nicaraguan (73.2%, a difference of 0.090%).
| Demographics | Rating | Rank | In Labor Force | Age 20-24 |
| Immigrants | South America | 0.2 /100 | #275 | Tragic 73.3% |
| Mongolians | 0.2 /100 | #276 | Tragic 73.3% |
| Immigrants | Malaysia | 0.2 /100 | #277 | Tragic 73.3% |
| Cypriots | 0.2 /100 | #278 | Tragic 73.3% |
| Venezuelans | 0.2 /100 | #279 | Tragic 73.3% |
| Bahamians | 0.1 /100 | #280 | Tragic 73.3% |
| Immigrants | Venezuela | 0.1 /100 | #281 | Tragic 73.2% |
| Immigrants | Spain | 0.1 /100 | #282 | Tragic 73.2% |
| Immigrants | Bahamas | 0.1 /100 | #283 | Tragic 73.2% |
| Kiowa | 0.1 /100 | #284 | Tragic 73.2% |
| Nicaraguans | 0.1 /100 | #285 | Tragic 73.2% |
| Immigrants | Lebanon | 0.1 /100 | #286 | Tragic 73.1% |
| Immigrants | Korea | 0.1 /100 | #287 | Tragic 73.1% |
| Argentineans | 0.1 /100 | #288 | Tragic 73.1% |
| U.S. Virgin Islanders | 0.1 /100 | #289 | Tragic 73.0% |