French vs Immigrants from Ireland In Labor Force | Age 20-24
COMPARE
French
Immigrants from Ireland
In Labor Force | Age 20-24
In Labor Force | Age 20-24 Comparison
French
Immigrants from Ireland
77.4%
IN LABOR FORCE | AGE 20-24
100.0/ 100
METRIC RATING
42nd/ 347
METRIC RANK
74.3%
IN LABOR FORCE | AGE 20-24
5.8/ 100
METRIC RATING
227th/ 347
METRIC RANK
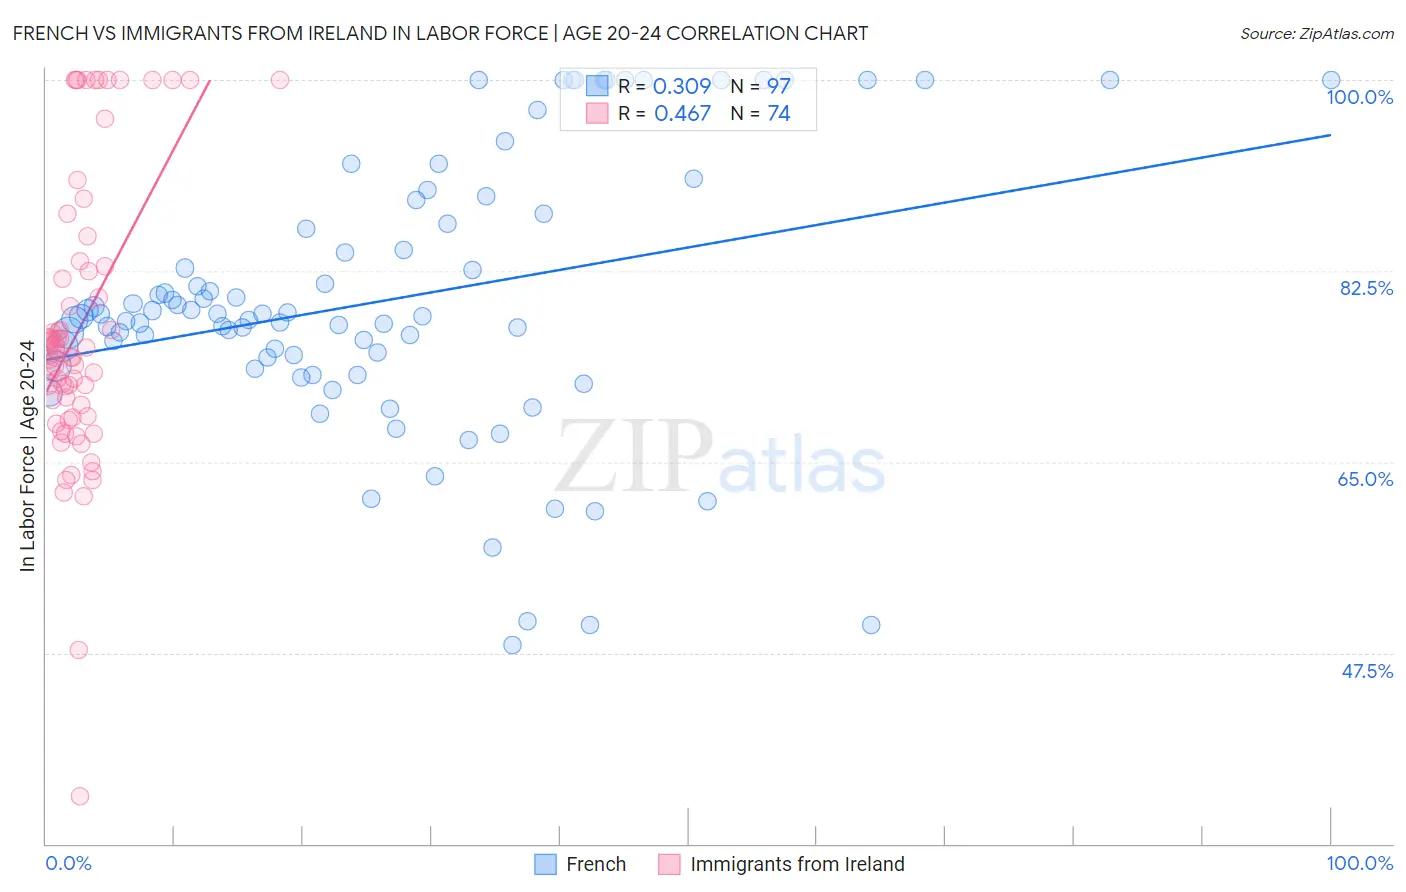
French vs Immigrants from Ireland In Labor Force | Age 20-24 Correlation Chart
The statistical analysis conducted on geographies consisting of 570,874,940 people shows a mild positive correlation between the proportion of French and labor force participation rate among population between the ages 20 and 24 in the United States with a correlation coefficient (R) of 0.309 and weighted average of 77.4%. Similarly, the statistical analysis conducted on geographies consisting of 240,706,674 people shows a moderate positive correlation between the proportion of Immigrants from Ireland and labor force participation rate among population between the ages 20 and 24 in the United States with a correlation coefficient (R) of 0.467 and weighted average of 74.3%, a difference of 4.2%.
In Labor Force | Age 20-24 Correlation Summary
| Measurement | French | Immigrants from Ireland |
| Minimum | 48.2% | 34.3% |
| Maximum | 100.0% | 100.0% |
| Range | 51.8% | 65.7% |
| Mean | 79.8% | 77.3% |
| Median | 78.3% | 74.9% |
| Interquartile 25% (IQ1) | 74.2% | 69.2% |
| Interquartile 75% (IQ3) | 87.3% | 82.9% |
| Interquartile Range (IQR) | 13.0% | 13.7% |
| Standard Deviation (Sample) | 12.4% | 13.1% |
| Standard Deviation (Population) | 12.4% | 13.0% |
Similar Demographics by In Labor Force | Age 20-24
Demographics Similar to French by In Labor Force | Age 20-24
In terms of in labor force | age 20-24, the demographic groups most similar to French are Immigrants from Laos (77.4%, a difference of 0.0%), Immigrants from Congo (77.4%, a difference of 0.010%), Fijian (77.4%, a difference of 0.020%), Scottish (77.4%, a difference of 0.030%), and Native Hawaiian (77.4%, a difference of 0.030%).
| Demographics | Rating | Rank | In Labor Force | Age 20-24 |
| Immigrants | Eastern Africa | 100.0 /100 | #35 | Exceptional 77.5% |
| Welsh | 100.0 /100 | #36 | Exceptional 77.5% |
| Czechoslovakians | 100.0 /100 | #37 | Exceptional 77.5% |
| Marshallese | 100.0 /100 | #38 | Exceptional 77.4% |
| Irish | 100.0 /100 | #39 | Exceptional 77.4% |
| Scottish | 100.0 /100 | #40 | Exceptional 77.4% |
| Immigrants | Congo | 100.0 /100 | #41 | Exceptional 77.4% |
| French | 100.0 /100 | #42 | Exceptional 77.4% |
| Immigrants | Laos | 100.0 /100 | #43 | Exceptional 77.4% |
| Fijians | 100.0 /100 | #44 | Exceptional 77.4% |
| Native Hawaiians | 100.0 /100 | #45 | Exceptional 77.4% |
| Samoans | 100.0 /100 | #46 | Exceptional 77.4% |
| Ethiopians | 100.0 /100 | #47 | Exceptional 77.3% |
| Serbians | 100.0 /100 | #48 | Exceptional 77.3% |
| Chinese | 100.0 /100 | #49 | Exceptional 77.3% |
Demographics Similar to Immigrants from Ireland by In Labor Force | Age 20-24
In terms of in labor force | age 20-24, the demographic groups most similar to Immigrants from Ireland are Immigrants from Fiji (74.3%, a difference of 0.010%), Ghanaian (74.3%, a difference of 0.030%), Immigrants from Ukraine (74.2%, a difference of 0.050%), Seminole (74.3%, a difference of 0.070%), and Immigrants from Sweden (74.2%, a difference of 0.090%).
| Demographics | Rating | Rank | In Labor Force | Age 20-24 |
| Immigrants | Norway | 10.3 /100 | #220 | Poor 74.5% |
| Chickasaw | 10.3 /100 | #221 | Poor 74.5% |
| Immigrants | India | 9.9 /100 | #222 | Tragic 74.4% |
| Hispanics or Latinos | 7.9 /100 | #223 | Tragic 74.4% |
| Seminole | 6.9 /100 | #224 | Tragic 74.3% |
| Ghanaians | 6.2 /100 | #225 | Tragic 74.3% |
| Immigrants | Fiji | 5.9 /100 | #226 | Tragic 74.3% |
| Immigrants | Ireland | 5.8 /100 | #227 | Tragic 74.3% |
| Immigrants | Ukraine | 5.1 /100 | #228 | Tragic 74.2% |
| Immigrants | Sweden | 4.6 /100 | #229 | Tragic 74.2% |
| Immigrants | Albania | 4.3 /100 | #230 | Tragic 74.2% |
| Immigrants | Greece | 4.1 /100 | #231 | Tragic 74.2% |
| Immigrants | Switzerland | 4.1 /100 | #232 | Tragic 74.2% |
| Immigrants | Chile | 3.7 /100 | #233 | Tragic 74.1% |
| Immigrants | Immigrants | 3.6 /100 | #234 | Tragic 74.1% |