Immigrants from El Salvador vs Macedonian In Labor Force | Age 20-64
COMPARE
Immigrants from El Salvador
Macedonian
In Labor Force | Age 20-64
In Labor Force | Age 20-64 Comparison
Immigrants from El Salvador
Macedonians
79.4%
IN LABOR FORCE | AGE 20-64
30.9/ 100
METRIC RATING
189th/ 347
METRIC RANK
80.2%
IN LABOR FORCE | AGE 20-64
98.7/ 100
METRIC RATING
66th/ 347
METRIC RANK
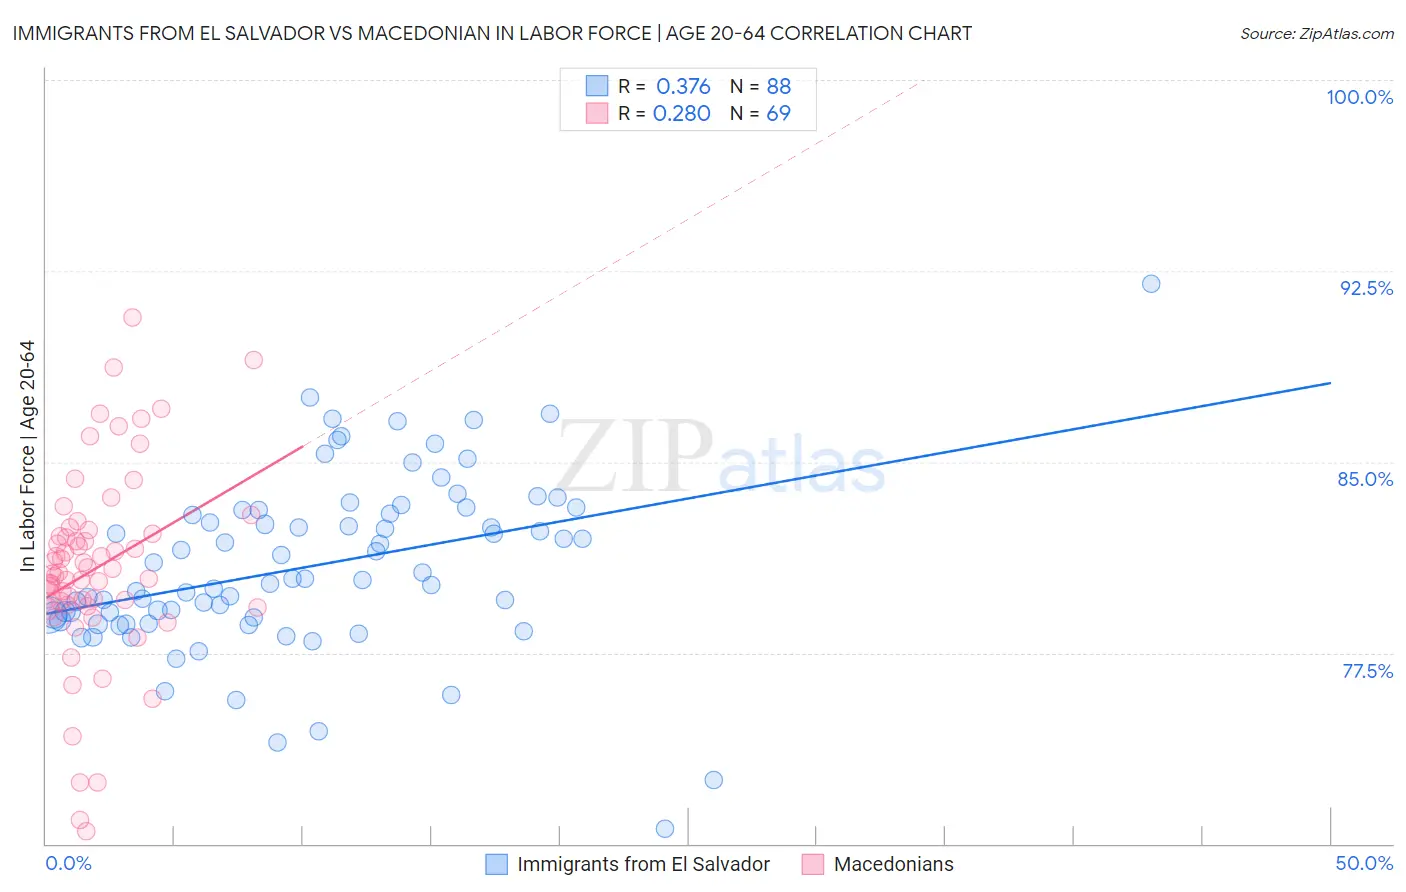
Immigrants from El Salvador vs Macedonian In Labor Force | Age 20-64 Correlation Chart
The statistical analysis conducted on geographies consisting of 357,792,299 people shows a mild positive correlation between the proportion of Immigrants from El Salvador and labor force participation rate among population between the ages 20 and 64 in the United States with a correlation coefficient (R) of 0.376 and weighted average of 79.4%. Similarly, the statistical analysis conducted on geographies consisting of 132,660,351 people shows a weak positive correlation between the proportion of Macedonians and labor force participation rate among population between the ages 20 and 64 in the United States with a correlation coefficient (R) of 0.280 and weighted average of 80.2%, a difference of 1.0%.
In Labor Force | Age 20-64 Correlation Summary
| Measurement | Immigrants from El Salvador | Macedonian |
| Minimum | 70.6% | 70.5% |
| Maximum | 92.0% | 90.7% |
| Range | 21.4% | 20.2% |
| Mean | 80.9% | 80.8% |
| Median | 80.4% | 80.7% |
| Interquartile 25% (IQ1) | 78.8% | 79.4% |
| Interquartile 75% (IQ3) | 83.0% | 82.3% |
| Interquartile Range (IQR) | 4.2% | 2.9% |
| Standard Deviation (Sample) | 3.4% | 3.8% |
| Standard Deviation (Population) | 3.4% | 3.8% |
Similar Demographics by In Labor Force | Age 20-64
Demographics Similar to Immigrants from El Salvador by In Labor Force | Age 20-64
In terms of in labor force | age 20-64, the demographic groups most similar to Immigrants from El Salvador are Immigrants from Syria (79.4%, a difference of 0.0%), Immigrants from Haiti (79.4%, a difference of 0.010%), Assyrian/Chaldean/Syriac (79.4%, a difference of 0.020%), Swiss (79.4%, a difference of 0.020%), and Northern European (79.5%, a difference of 0.030%).
| Demographics | Rating | Rank | In Labor Force | Age 20-64 |
| Malaysians | 37.1 /100 | #182 | Fair 79.5% |
| Immigrants | Hungary | 36.8 /100 | #183 | Fair 79.5% |
| Finns | 35.9 /100 | #184 | Fair 79.5% |
| Israelis | 34.7 /100 | #185 | Fair 79.5% |
| Northern Europeans | 34.5 /100 | #186 | Fair 79.5% |
| Assyrians/Chaldeans/Syriacs | 33.3 /100 | #187 | Fair 79.4% |
| Immigrants | Haiti | 32.1 /100 | #188 | Fair 79.4% |
| Immigrants | El Salvador | 30.9 /100 | #189 | Fair 79.4% |
| Immigrants | Syria | 30.8 /100 | #190 | Fair 79.4% |
| Swiss | 28.9 /100 | #191 | Fair 79.4% |
| Immigrants | Denmark | 26.9 /100 | #192 | Fair 79.4% |
| Indonesians | 26.1 /100 | #193 | Fair 79.4% |
| Immigrants | Thailand | 24.8 /100 | #194 | Fair 79.4% |
| Immigrants | Austria | 23.7 /100 | #195 | Fair 79.4% |
| Ecuadorians | 23.1 /100 | #196 | Fair 79.4% |
Demographics Similar to Macedonians by In Labor Force | Age 20-64
In terms of in labor force | age 20-64, the demographic groups most similar to Macedonians are Lithuanian (80.2%, a difference of 0.0%), Taiwanese (80.2%, a difference of 0.0%), Immigrants from Albania (80.3%, a difference of 0.010%), Bhutanese (80.2%, a difference of 0.010%), and Albanian (80.2%, a difference of 0.010%).
| Demographics | Rating | Rank | In Labor Force | Age 20-64 |
| Swedes | 98.9 /100 | #59 | Exceptional 80.3% |
| Tongans | 98.8 /100 | #60 | Exceptional 80.3% |
| Burmese | 98.8 /100 | #61 | Exceptional 80.3% |
| Carpatho Rusyns | 98.8 /100 | #62 | Exceptional 80.3% |
| Immigrants | Korea | 98.8 /100 | #63 | Exceptional 80.3% |
| Immigrants | Albania | 98.7 /100 | #64 | Exceptional 80.3% |
| Lithuanians | 98.7 /100 | #65 | Exceptional 80.2% |
| Macedonians | 98.7 /100 | #66 | Exceptional 80.2% |
| Taiwanese | 98.6 /100 | #67 | Exceptional 80.2% |
| Bhutanese | 98.6 /100 | #68 | Exceptional 80.2% |
| Albanians | 98.6 /100 | #69 | Exceptional 80.2% |
| Immigrants | Turkey | 98.5 /100 | #70 | Exceptional 80.2% |
| Soviet Union | 98.5 /100 | #71 | Exceptional 80.2% |
| Eastern Europeans | 98.4 /100 | #72 | Exceptional 80.2% |
| Cypriots | 98.2 /100 | #73 | Exceptional 80.2% |