Immigrants from Caribbean vs Finnish In Labor Force | Age 45-54
COMPARE
Immigrants from Caribbean
Finnish
In Labor Force | Age 45-54
In Labor Force | Age 45-54 Comparison
Immigrants from Caribbean
Finns
82.1%
IN LABOR FORCE | AGE 45-54
2.5/ 100
METRIC RATING
226th/ 347
METRIC RANK
83.1%
IN LABOR FORCE | AGE 45-54
83.3/ 100
METRIC RATING
131st/ 347
METRIC RANK
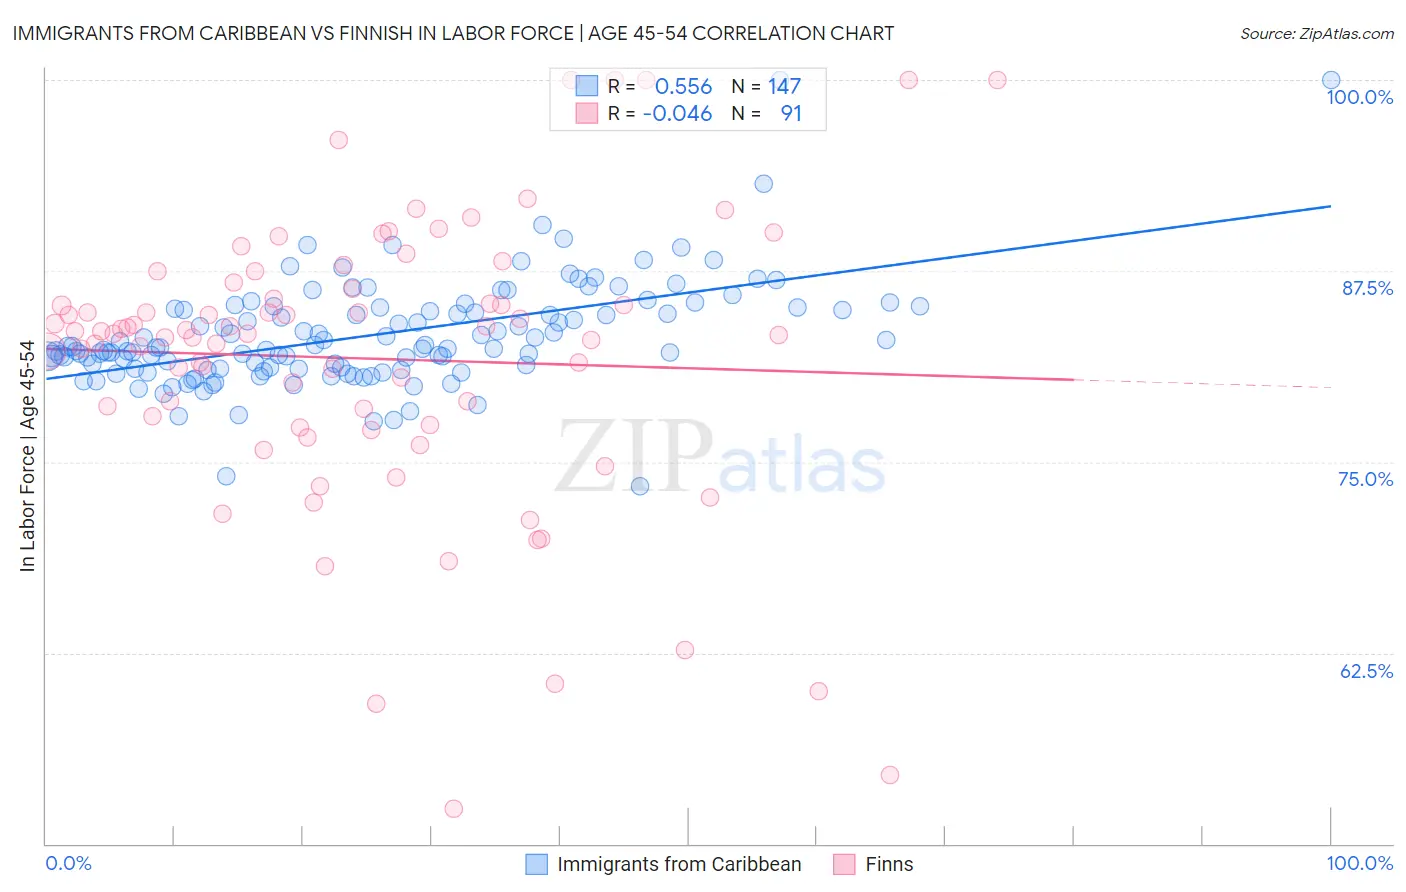
Immigrants from Caribbean vs Finnish In Labor Force | Age 45-54 Correlation Chart
The statistical analysis conducted on geographies consisting of 449,588,789 people shows a substantial positive correlation between the proportion of Immigrants from Caribbean and labor force participation rate among population between the ages 45 and 54 in the United States with a correlation coefficient (R) of 0.556 and weighted average of 82.1%. Similarly, the statistical analysis conducted on geographies consisting of 404,469,956 people shows no correlation between the proportion of Finns and labor force participation rate among population between the ages 45 and 54 in the United States with a correlation coefficient (R) of -0.046 and weighted average of 83.1%, a difference of 1.2%.
In Labor Force | Age 45-54 Correlation Summary
| Measurement | Immigrants from Caribbean | Finnish |
| Minimum | 73.4% | 52.3% |
| Maximum | 100.0% | 100.0% |
| Range | 26.6% | 47.7% |
| Mean | 83.3% | 81.8% |
| Median | 82.5% | 83.4% |
| Interquartile 25% (IQ1) | 81.1% | 77.4% |
| Interquartile 75% (IQ3) | 85.1% | 86.4% |
| Interquartile Range (IQR) | 4.0% | 8.9% |
| Standard Deviation (Sample) | 3.6% | 9.4% |
| Standard Deviation (Population) | 3.5% | 9.3% |
Similar Demographics by In Labor Force | Age 45-54
Demographics Similar to Immigrants from Caribbean by In Labor Force | Age 45-54
In terms of in labor force | age 45-54, the demographic groups most similar to Immigrants from Caribbean are Immigrants from Oceania (82.1%, a difference of 0.0%), Immigrants from Germany (82.1%, a difference of 0.010%), Immigrants from Jamaica (82.1%, a difference of 0.020%), Cape Verdean (82.1%, a difference of 0.040%), and Immigrants (82.1%, a difference of 0.050%).
| Demographics | Rating | Rank | In Labor Force | Age 45-54 |
| French | 4.1 /100 | #219 | Tragic 82.2% |
| Bahamians | 3.6 /100 | #220 | Tragic 82.2% |
| Panamanians | 3.5 /100 | #221 | Tragic 82.2% |
| Immigrants | Ecuador | 3.4 /100 | #222 | Tragic 82.2% |
| Immigrants | Immigrants | 3.1 /100 | #223 | Tragic 82.1% |
| Immigrants | Jamaica | 2.7 /100 | #224 | Tragic 82.1% |
| Immigrants | Oceania | 2.5 /100 | #225 | Tragic 82.1% |
| Immigrants | Caribbean | 2.5 /100 | #226 | Tragic 82.1% |
| Immigrants | Germany | 2.4 /100 | #227 | Tragic 82.1% |
| Cape Verdeans | 2.1 /100 | #228 | Tragic 82.1% |
| Immigrants | Burma/Myanmar | 1.9 /100 | #229 | Tragic 82.0% |
| Jamaicans | 1.8 /100 | #230 | Tragic 82.0% |
| Immigrants | Senegal | 1.7 /100 | #231 | Tragic 82.0% |
| Immigrants | Portugal | 1.7 /100 | #232 | Tragic 82.0% |
| Malaysians | 1.7 /100 | #233 | Tragic 82.0% |
Demographics Similar to Finns by In Labor Force | Age 45-54
In terms of in labor force | age 45-54, the demographic groups most similar to Finns are Immigrants from Ukraine (83.0%, a difference of 0.010%), Liberian (83.0%, a difference of 0.010%), Immigrants from Israel (83.1%, a difference of 0.020%), Sudanese (83.0%, a difference of 0.020%), and Immigrants from Jordan (83.1%, a difference of 0.030%).
| Demographics | Rating | Rank | In Labor Force | Age 45-54 |
| Bermudans | 88.0 /100 | #124 | Excellent 83.1% |
| Immigrants | Iran | 87.2 /100 | #125 | Excellent 83.1% |
| Immigrants | Belgium | 86.4 /100 | #126 | Excellent 83.1% |
| Immigrants | Jordan | 85.2 /100 | #127 | Excellent 83.1% |
| Germans | 85.1 /100 | #128 | Excellent 83.1% |
| Immigrants | Northern Europe | 85.1 /100 | #129 | Excellent 83.1% |
| Immigrants | Israel | 84.7 /100 | #130 | Excellent 83.1% |
| Finns | 83.3 /100 | #131 | Excellent 83.1% |
| Immigrants | Ukraine | 82.9 /100 | #132 | Excellent 83.0% |
| Liberians | 82.7 /100 | #133 | Excellent 83.0% |
| Sudanese | 82.0 /100 | #134 | Excellent 83.0% |
| Austrians | 81.3 /100 | #135 | Excellent 83.0% |
| Immigrants | Kazakhstan | 81.0 /100 | #136 | Excellent 83.0% |
| Immigrants | Spain | 80.4 /100 | #137 | Excellent 83.0% |
| Ghanaians | 79.5 /100 | #138 | Good 83.0% |