Immigrants from Cambodia vs Slovak In Labor Force | Age 25-29
COMPARE
Immigrants from Cambodia
Slovak
In Labor Force | Age 25-29
In Labor Force | Age 25-29 Comparison
Immigrants from Cambodia
Slovaks
84.4%
IN LABOR FORCE | AGE 25-29
14.3/ 100
METRIC RATING
206th/ 347
METRIC RANK
85.8%
IN LABOR FORCE | AGE 25-29
100.0/ 100
METRIC RATING
32nd/ 347
METRIC RANK
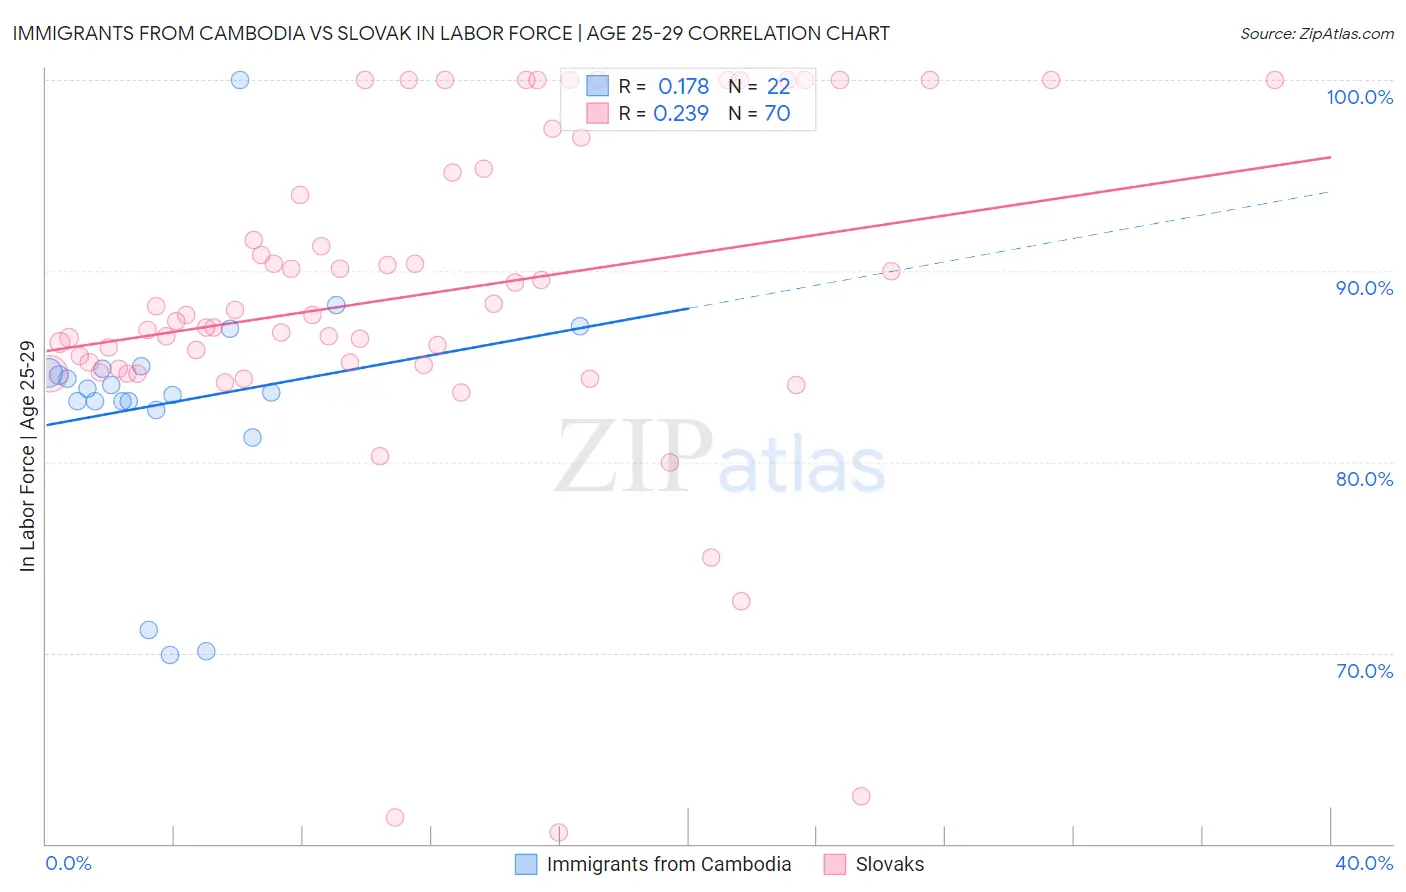
Immigrants from Cambodia vs Slovak In Labor Force | Age 25-29 Correlation Chart
The statistical analysis conducted on geographies consisting of 205,138,607 people shows a poor positive correlation between the proportion of Immigrants from Cambodia and labor force participation rate among population between the ages 25 and 29 in the United States with a correlation coefficient (R) of 0.178 and weighted average of 84.4%. Similarly, the statistical analysis conducted on geographies consisting of 397,677,043 people shows a weak positive correlation between the proportion of Slovaks and labor force participation rate among population between the ages 25 and 29 in the United States with a correlation coefficient (R) of 0.239 and weighted average of 85.8%, a difference of 1.7%.
In Labor Force | Age 25-29 Correlation Summary
| Measurement | Immigrants from Cambodia | Slovak |
| Minimum | 69.9% | 60.6% |
| Maximum | 100.0% | 100.0% |
| Range | 30.1% | 39.4% |
| Mean | 83.1% | 88.8% |
| Median | 83.8% | 87.7% |
| Interquartile 25% (IQ1) | 83.2% | 85.1% |
| Interquartile 75% (IQ3) | 84.9% | 95.4% |
| Interquartile Range (IQR) | 1.7% | 10.3% |
| Standard Deviation (Sample) | 6.3% | 8.8% |
| Standard Deviation (Population) | 6.2% | 8.7% |
Similar Demographics by In Labor Force | Age 25-29
Demographics Similar to Immigrants from Cambodia by In Labor Force | Age 25-29
In terms of in labor force | age 25-29, the demographic groups most similar to Immigrants from Cambodia are Venezuelan (84.4%, a difference of 0.010%), Ecuadorian (84.4%, a difference of 0.010%), Afghan (84.4%, a difference of 0.020%), Immigrants from Afghanistan (84.4%, a difference of 0.020%), and Immigrants from Armenia (84.4%, a difference of 0.020%).
| Demographics | Rating | Rank | In Labor Force | Age 25-29 |
| Immigrants | Germany | 18.3 /100 | #199 | Poor 84.4% |
| Immigrants | Kazakhstan | 17.5 /100 | #200 | Poor 84.4% |
| Laotians | 16.6 /100 | #201 | Poor 84.4% |
| Afghans | 15.9 /100 | #202 | Poor 84.4% |
| Immigrants | Afghanistan | 15.6 /100 | #203 | Poor 84.4% |
| Venezuelans | 15.1 /100 | #204 | Poor 84.4% |
| Ecuadorians | 14.8 /100 | #205 | Poor 84.4% |
| Immigrants | Cambodia | 14.3 /100 | #206 | Poor 84.4% |
| Immigrants | Armenia | 13.3 /100 | #207 | Poor 84.4% |
| Immigrants | Indonesia | 13.2 /100 | #208 | Poor 84.4% |
| Immigrants | Jordan | 12.8 /100 | #209 | Poor 84.4% |
| Chinese | 12.7 /100 | #210 | Poor 84.3% |
| Immigrants | Venezuela | 12.6 /100 | #211 | Poor 84.3% |
| Sub-Saharan Africans | 11.7 /100 | #212 | Poor 84.3% |
| Japanese | 11.4 /100 | #213 | Poor 84.3% |
Demographics Similar to Slovaks by In Labor Force | Age 25-29
In terms of in labor force | age 25-29, the demographic groups most similar to Slovaks are German Russian (85.8%, a difference of 0.0%), Immigrants from Bulgaria (85.8%, a difference of 0.0%), Immigrants from Serbia (85.9%, a difference of 0.010%), Lithuanian (85.8%, a difference of 0.030%), and Cypriot (85.8%, a difference of 0.040%).
| Demographics | Rating | Rank | In Labor Force | Age 25-29 |
| Sudanese | 100.0 /100 | #25 | Exceptional 85.9% |
| Immigrants | North Macedonia | 100.0 /100 | #26 | Exceptional 85.9% |
| Paraguayans | 100.0 /100 | #27 | Exceptional 85.9% |
| Ugandans | 100.0 /100 | #28 | Exceptional 85.9% |
| Immigrants | Liberia | 100.0 /100 | #29 | Exceptional 85.9% |
| Immigrants | Serbia | 100.0 /100 | #30 | Exceptional 85.9% |
| German Russians | 100.0 /100 | #31 | Exceptional 85.8% |
| Slovaks | 100.0 /100 | #32 | Exceptional 85.8% |
| Immigrants | Bulgaria | 100.0 /100 | #33 | Exceptional 85.8% |
| Lithuanians | 99.9 /100 | #34 | Exceptional 85.8% |
| Cypriots | 99.9 /100 | #35 | Exceptional 85.8% |
| Immigrants | Nepal | 99.9 /100 | #36 | Exceptional 85.8% |
| Poles | 99.9 /100 | #37 | Exceptional 85.8% |
| Sierra Leoneans | 99.9 /100 | #38 | Exceptional 85.8% |
| Croatians | 99.9 /100 | #39 | Exceptional 85.8% |