Immigrants from Brazil vs Immigrants In Labor Force | Age > 16
COMPARE
Immigrants from Brazil
Immigrants
In Labor Force | Age > 16
In Labor Force | Age > 16 Comparison
Immigrants from Brazil
Immigrants
66.7%
IN LABOR FORCE | AGE > 16
100.0/ 100
METRIC RATING
45th/ 347
METRIC RANK
65.4%
IN LABOR FORCE | AGE > 16
81.9/ 100
METRIC RATING
150th/ 347
METRIC RANK
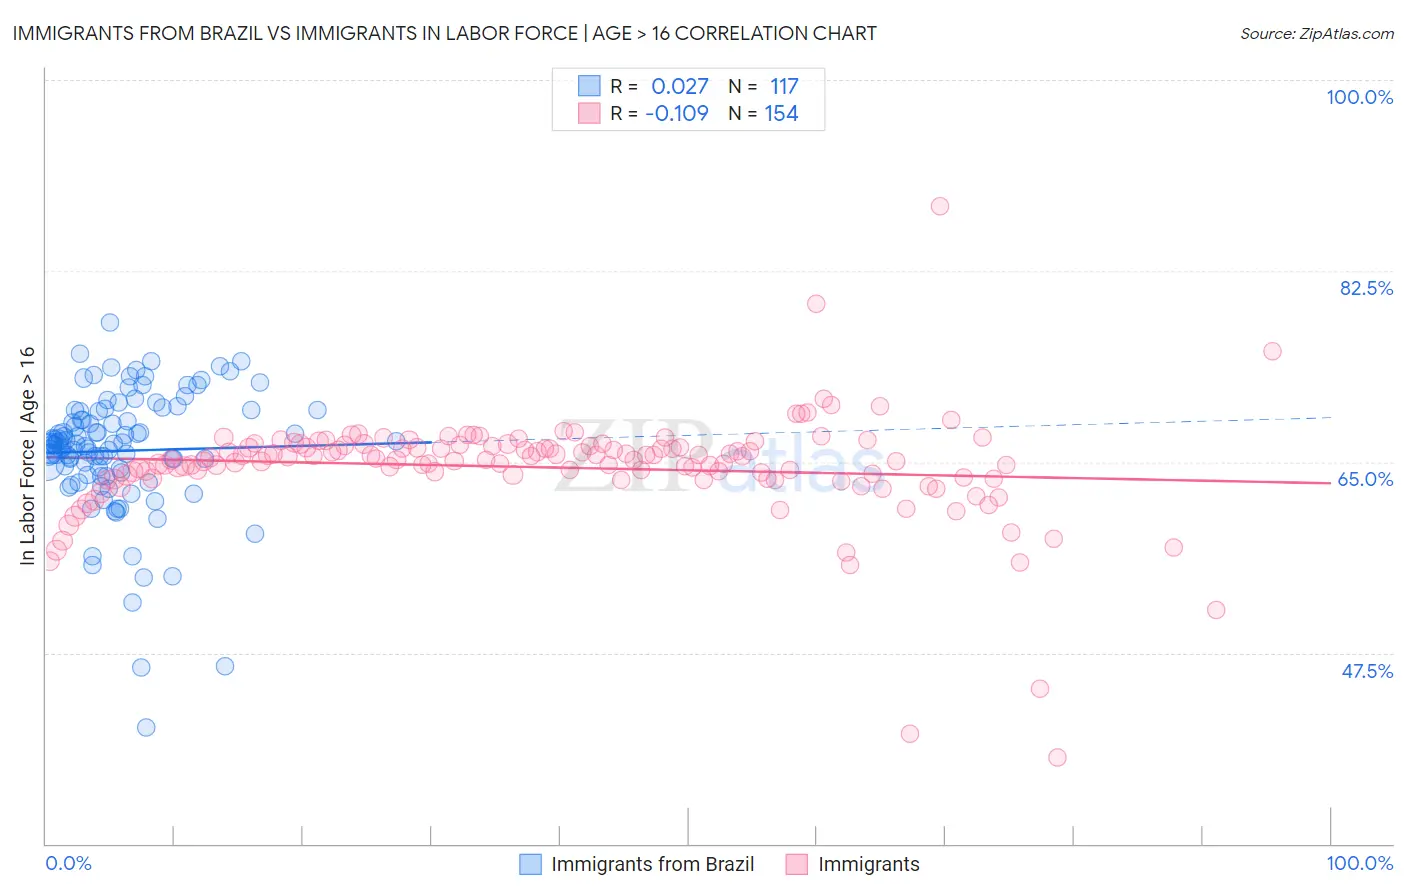
Immigrants from Brazil vs Immigrants In Labor Force | Age > 16 Correlation Chart
The statistical analysis conducted on geographies consisting of 343,023,215 people shows no correlation between the proportion of Immigrants from Brazil and labor force participation rate among population ages 16 and over in the United States with a correlation coefficient (R) of 0.027 and weighted average of 66.7%. Similarly, the statistical analysis conducted on geographies consisting of 577,773,674 people shows a poor negative correlation between the proportion of Immigrants and labor force participation rate among population ages 16 and over in the United States with a correlation coefficient (R) of -0.109 and weighted average of 65.4%, a difference of 1.9%.
In Labor Force | Age > 16 Correlation Summary
| Measurement | Immigrants from Brazil | Immigrants |
| Minimum | 40.7% | 37.9% |
| Maximum | 77.8% | 88.4% |
| Range | 37.1% | 50.5% |
| Mean | 66.0% | 64.5% |
| Median | 66.6% | 65.2% |
| Interquartile 25% (IQ1) | 63.9% | 63.5% |
| Interquartile 75% (IQ3) | 69.7% | 66.5% |
| Interquartile Range (IQR) | 5.8% | 3.0% |
| Standard Deviation (Sample) | 5.8% | 5.1% |
| Standard Deviation (Population) | 5.8% | 5.1% |
Similar Demographics by In Labor Force | Age > 16
Demographics Similar to Immigrants from Brazil by In Labor Force | Age > 16
In terms of in labor force | age > 16, the demographic groups most similar to Immigrants from Brazil are Immigrants from Pakistan (66.7%, a difference of 0.050%), Brazilian (66.6%, a difference of 0.070%), Immigrants from Bulgaria (66.6%, a difference of 0.070%), Nigerian (66.6%, a difference of 0.080%), and Luxembourger (66.7%, a difference of 0.10%).
| Demographics | Rating | Rank | In Labor Force | Age > 16 |
| Immigrants | Nigeria | 100.0 /100 | #38 | Exceptional 66.9% |
| Salvadorans | 100.0 /100 | #39 | Exceptional 66.8% |
| Immigrants | El Salvador | 100.0 /100 | #40 | Exceptional 66.8% |
| Immigrants | Zimbabwe | 100.0 /100 | #41 | Exceptional 66.8% |
| Senegalese | 100.0 /100 | #42 | Exceptional 66.7% |
| Luxembourgers | 100.0 /100 | #43 | Exceptional 66.7% |
| Immigrants | Pakistan | 100.0 /100 | #44 | Exceptional 66.7% |
| Immigrants | Brazil | 100.0 /100 | #45 | Exceptional 66.7% |
| Brazilians | 100.0 /100 | #46 | Exceptional 66.6% |
| Immigrants | Bulgaria | 100.0 /100 | #47 | Exceptional 66.6% |
| Nigerians | 100.0 /100 | #48 | Exceptional 66.6% |
| Immigrants | Northern Africa | 100.0 /100 | #49 | Exceptional 66.6% |
| Cape Verdeans | 100.0 /100 | #50 | Exceptional 66.6% |
| Immigrants | Kuwait | 100.0 /100 | #51 | Exceptional 66.5% |
| Paraguayans | 99.9 /100 | #52 | Exceptional 66.5% |
Demographics Similar to Immigrants by In Labor Force | Age > 16
In terms of in labor force | age > 16, the demographic groups most similar to Immigrants are Czech (65.4%, a difference of 0.010%), Yugoslavian (65.4%, a difference of 0.010%), Immigrants from China (65.4%, a difference of 0.020%), Immigrants from Eastern Europe (65.4%, a difference of 0.060%), and Immigrants from Albania (65.4%, a difference of 0.080%).
| Demographics | Rating | Rank | In Labor Force | Age > 16 |
| Latvians | 89.4 /100 | #143 | Excellent 65.5% |
| Immigrants | Romania | 88.6 /100 | #144 | Excellent 65.5% |
| Tlingit-Haida | 88.3 /100 | #145 | Excellent 65.5% |
| Cypriots | 88.2 /100 | #146 | Excellent 65.5% |
| Immigrants | Oceania | 87.5 /100 | #147 | Excellent 65.5% |
| Bhutanese | 86.3 /100 | #148 | Excellent 65.5% |
| Immigrants | Albania | 85.7 /100 | #149 | Excellent 65.4% |
| Immigrants | Immigrants | 81.9 /100 | #150 | Excellent 65.4% |
| Czechs | 81.5 /100 | #151 | Excellent 65.4% |
| Yugoslavians | 81.3 /100 | #152 | Excellent 65.4% |
| Immigrants | China | 80.5 /100 | #153 | Excellent 65.4% |
| Immigrants | Eastern Europe | 78.3 /100 | #154 | Good 65.4% |
| Immigrants | Armenia | 76.6 /100 | #155 | Good 65.3% |
| Immigrants | Ireland | 75.9 /100 | #156 | Good 65.3% |
| Immigrants | Russia | 75.7 /100 | #157 | Good 65.3% |