Immigrants from Brazil vs Peruvian In Labor Force | Age 20-24
COMPARE
Immigrants from Brazil
Peruvian
In Labor Force | Age 20-24
In Labor Force | Age 20-24 Comparison
Immigrants from Brazil
Peruvians
75.5%
IN LABOR FORCE | AGE 20-24
84.8/ 100
METRIC RATING
136th/ 347
METRIC RANK
74.5%
IN LABOR FORCE | AGE 20-24
13.3/ 100
METRIC RATING
213th/ 347
METRIC RANK
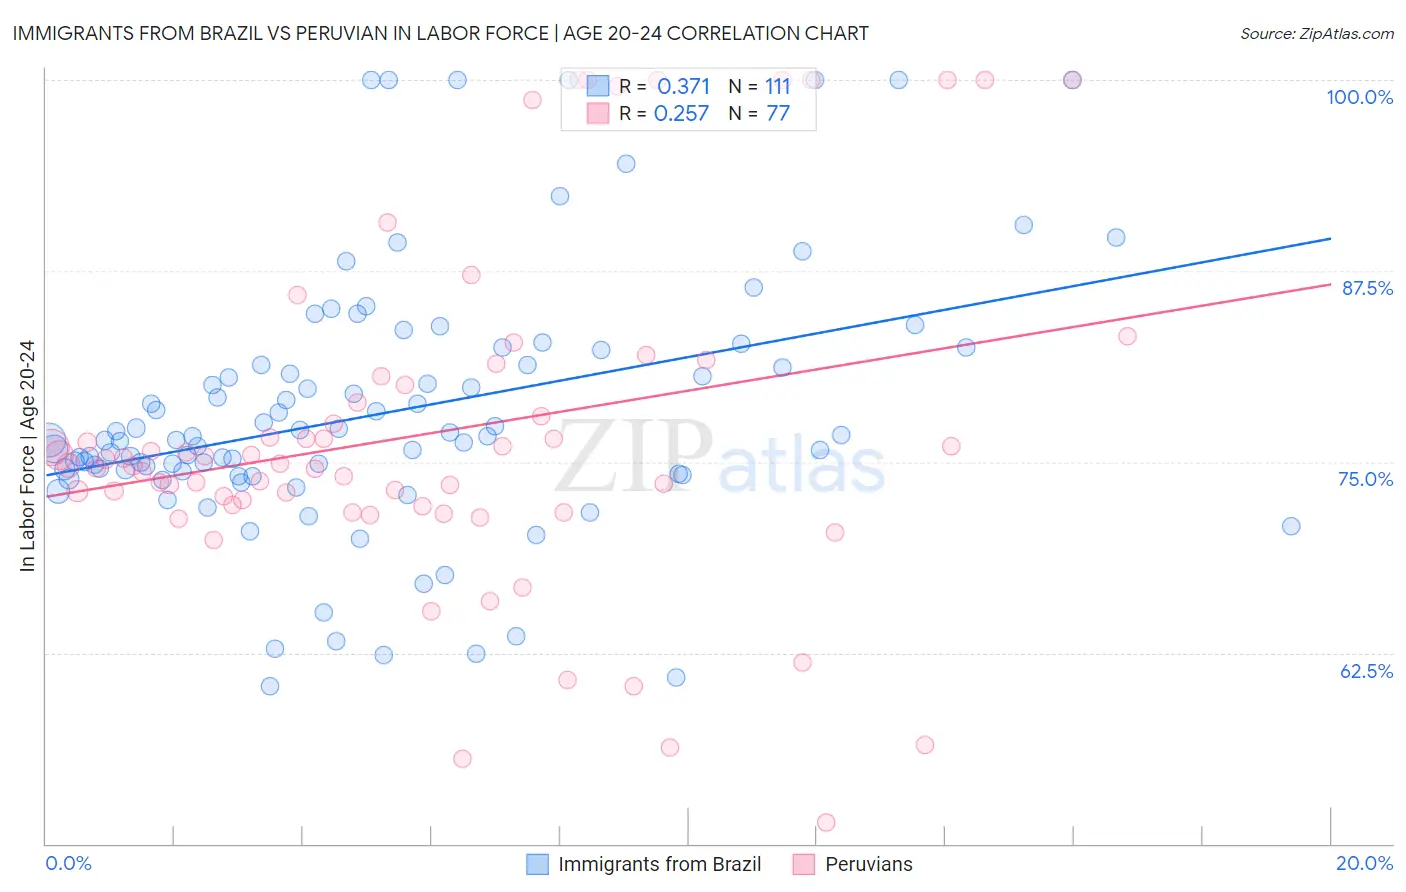
Immigrants from Brazil vs Peruvian In Labor Force | Age 20-24 Correlation Chart
The statistical analysis conducted on geographies consisting of 342,949,141 people shows a mild positive correlation between the proportion of Immigrants from Brazil and labor force participation rate among population between the ages 20 and 24 in the United States with a correlation coefficient (R) of 0.371 and weighted average of 75.5%. Similarly, the statistical analysis conducted on geographies consisting of 363,167,677 people shows a weak positive correlation between the proportion of Peruvians and labor force participation rate among population between the ages 20 and 24 in the United States with a correlation coefficient (R) of 0.257 and weighted average of 74.5%, a difference of 1.3%.
In Labor Force | Age 20-24 Correlation Summary
| Measurement | Immigrants from Brazil | Peruvian |
| Minimum | 60.3% | 51.4% |
| Maximum | 100.0% | 100.0% |
| Range | 39.7% | 48.6% |
| Mean | 78.2% | 76.9% |
| Median | 76.4% | 74.9% |
| Interquartile 25% (IQ1) | 74.2% | 72.1% |
| Interquartile 75% (IQ3) | 81.3% | 80.3% |
| Interquartile Range (IQR) | 7.1% | 8.2% |
| Standard Deviation (Sample) | 8.5% | 11.1% |
| Standard Deviation (Population) | 8.5% | 11.1% |
Similar Demographics by In Labor Force | Age 20-24
Demographics Similar to Immigrants from Brazil by In Labor Force | Age 20-24
In terms of in labor force | age 20-24, the demographic groups most similar to Immigrants from Brazil are Jordanian (75.5%, a difference of 0.0%), Australian (75.5%, a difference of 0.0%), Immigrants from England (75.5%, a difference of 0.010%), Delaware (75.5%, a difference of 0.010%), and Yaqui (75.5%, a difference of 0.020%).
| Demographics | Rating | Rank | In Labor Force | Age 20-24 |
| Iroquois | 89.1 /100 | #129 | Excellent 75.6% |
| Immigrants | Austria | 88.8 /100 | #130 | Excellent 75.6% |
| Immigrants | Jordan | 88.5 /100 | #131 | Excellent 75.6% |
| Palestinians | 88.4 /100 | #132 | Excellent 75.6% |
| Zimbabweans | 88.2 /100 | #133 | Excellent 75.6% |
| Estonians | 87.1 /100 | #134 | Excellent 75.6% |
| Yaqui | 85.5 /100 | #135 | Excellent 75.5% |
| Immigrants | Brazil | 84.8 /100 | #136 | Excellent 75.5% |
| Jordanians | 84.8 /100 | #137 | Excellent 75.5% |
| Australians | 84.8 /100 | #138 | Excellent 75.5% |
| Immigrants | England | 84.6 /100 | #139 | Excellent 75.5% |
| Delaware | 84.5 /100 | #140 | Excellent 75.5% |
| Romanians | 84.1 /100 | #141 | Excellent 75.5% |
| Blackfeet | 83.6 /100 | #142 | Excellent 75.5% |
| Spaniards | 82.0 /100 | #143 | Excellent 75.5% |
Demographics Similar to Peruvians by In Labor Force | Age 20-24
In terms of in labor force | age 20-24, the demographic groups most similar to Peruvians are Creek (74.5%, a difference of 0.0%), Immigrants from Southern Europe (74.5%, a difference of 0.0%), Immigrants from Ghana (74.5%, a difference of 0.020%), Immigrants from Kuwait (74.5%, a difference of 0.020%), and Chilean (74.5%, a difference of 0.030%).
| Demographics | Rating | Rank | In Labor Force | Age 20-24 |
| Sioux | 17.5 /100 | #206 | Poor 74.6% |
| Albanians | 16.2 /100 | #207 | Poor 74.6% |
| Immigrants | Uruguay | 15.8 /100 | #208 | Poor 74.6% |
| Arabs | 15.8 /100 | #209 | Poor 74.6% |
| Uruguayans | 15.1 /100 | #210 | Poor 74.6% |
| Immigrants | Australia | 14.7 /100 | #211 | Poor 74.6% |
| Creek | 13.3 /100 | #212 | Poor 74.5% |
| Peruvians | 13.3 /100 | #213 | Poor 74.5% |
| Immigrants | Southern Europe | 13.2 /100 | #214 | Poor 74.5% |
| Immigrants | Ghana | 12.7 /100 | #215 | Poor 74.5% |
| Immigrants | Kuwait | 12.7 /100 | #216 | Poor 74.5% |
| Chileans | 12.5 /100 | #217 | Poor 74.5% |
| Immigrants | Peru | 10.6 /100 | #218 | Poor 74.5% |
| Nepalese | 10.5 /100 | #219 | Poor 74.5% |
| Immigrants | Norway | 10.3 /100 | #220 | Poor 74.5% |