Slovene vs Immigrants from Zimbabwe In Labor Force | Age 20-24
COMPARE
Slovene
Immigrants from Zimbabwe
In Labor Force | Age 20-24
In Labor Force | Age 20-24 Comparison
Slovenes
Immigrants from Zimbabwe
78.7%
IN LABOR FORCE | AGE 20-24
100.0/ 100
METRIC RATING
10th/ 347
METRIC RANK
75.9%
IN LABOR FORCE | AGE 20-24
95.1/ 100
METRIC RATING
114th/ 347
METRIC RANK
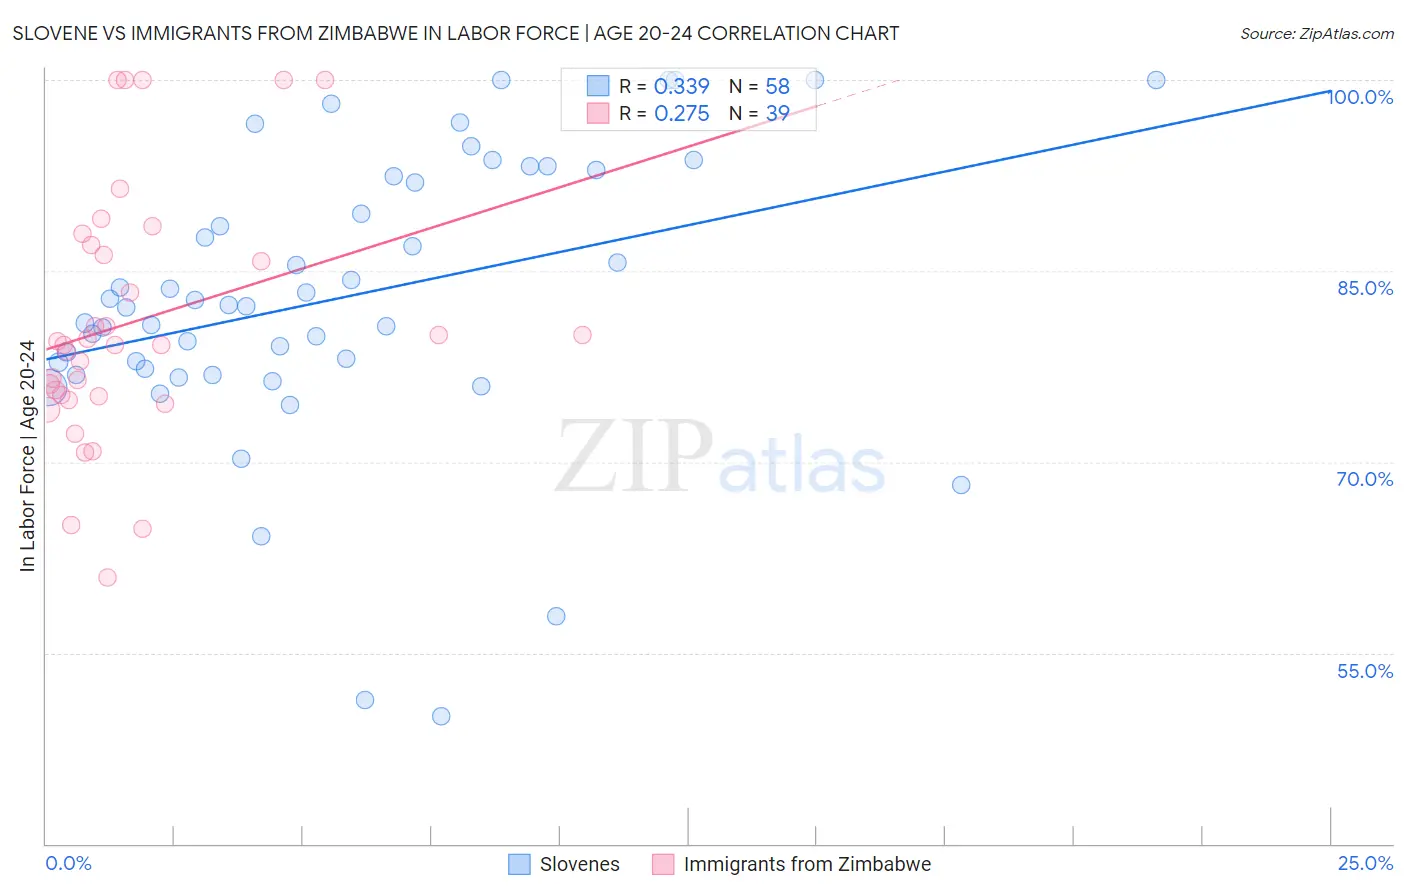
Slovene vs Immigrants from Zimbabwe In Labor Force | Age 20-24 Correlation Chart
The statistical analysis conducted on geographies consisting of 261,217,826 people shows a mild positive correlation between the proportion of Slovenes and labor force participation rate among population between the ages 20 and 24 in the United States with a correlation coefficient (R) of 0.339 and weighted average of 78.7%. Similarly, the statistical analysis conducted on geographies consisting of 117,807,327 people shows a weak positive correlation between the proportion of Immigrants from Zimbabwe and labor force participation rate among population between the ages 20 and 24 in the United States with a correlation coefficient (R) of 0.275 and weighted average of 75.9%, a difference of 3.7%.
In Labor Force | Age 20-24 Correlation Summary
| Measurement | Slovene | Immigrants from Zimbabwe |
| Minimum | 50.0% | 60.9% |
| Maximum | 100.0% | 100.0% |
| Range | 50.0% | 39.1% |
| Mean | 82.9% | 81.0% |
| Median | 82.3% | 79.2% |
| Interquartile 25% (IQ1) | 77.3% | 75.2% |
| Interquartile 75% (IQ3) | 92.5% | 87.0% |
| Interquartile Range (IQR) | 15.1% | 11.9% |
| Standard Deviation (Sample) | 11.1% | 9.9% |
| Standard Deviation (Population) | 11.0% | 9.7% |
Similar Demographics by In Labor Force | Age 20-24
Demographics Similar to Slovenes by In Labor Force | Age 20-24
In terms of in labor force | age 20-24, the demographic groups most similar to Slovenes are Finnish (78.7%, a difference of 0.040%), German (78.6%, a difference of 0.15%), Swedish (78.8%, a difference of 0.16%), Scandinavian (78.5%, a difference of 0.21%), and Immigrants from Cabo Verde (78.9%, a difference of 0.22%).
| Demographics | Rating | Rank | In Labor Force | Age 20-24 |
| Somalis | 100.0 /100 | #3 | Exceptional 79.3% |
| Alaskan Athabascans | 100.0 /100 | #4 | Exceptional 79.1% |
| Aleuts | 100.0 /100 | #5 | Exceptional 79.0% |
| Danes | 100.0 /100 | #6 | Exceptional 79.0% |
| Luxembourgers | 100.0 /100 | #7 | Exceptional 79.0% |
| Immigrants | Cabo Verde | 100.0 /100 | #8 | Exceptional 78.9% |
| Swedes | 100.0 /100 | #9 | Exceptional 78.8% |
| Slovenes | 100.0 /100 | #10 | Exceptional 78.7% |
| Finns | 100.0 /100 | #11 | Exceptional 78.7% |
| Germans | 100.0 /100 | #12 | Exceptional 78.6% |
| Scandinavians | 100.0 /100 | #13 | Exceptional 78.5% |
| Czechs | 100.0 /100 | #14 | Exceptional 78.5% |
| Sudanese | 100.0 /100 | #15 | Exceptional 78.4% |
| Dutch | 100.0 /100 | #16 | Exceptional 78.4% |
| Cape Verdeans | 100.0 /100 | #17 | Exceptional 78.3% |
Demographics Similar to Immigrants from Zimbabwe by In Labor Force | Age 20-24
In terms of in labor force | age 20-24, the demographic groups most similar to Immigrants from Zimbabwe are Alaska Native (75.9%, a difference of 0.0%), Immigrants from Netherlands (75.9%, a difference of 0.010%), Immigrants from North America (75.9%, a difference of 0.010%), Assyrian/Chaldean/Syriac (75.9%, a difference of 0.020%), and Spanish American (75.8%, a difference of 0.020%).
| Demographics | Rating | Rank | In Labor Force | Age 20-24 |
| Greeks | 96.9 /100 | #107 | Exceptional 76.0% |
| Iraqis | 96.6 /100 | #108 | Exceptional 76.0% |
| Cherokee | 95.8 /100 | #109 | Exceptional 75.9% |
| Immigrants | Morocco | 95.8 /100 | #110 | Exceptional 75.9% |
| Ukrainians | 95.7 /100 | #111 | Exceptional 75.9% |
| Immigrants | Canada | 95.6 /100 | #112 | Exceptional 75.9% |
| Immigrants | Netherlands | 95.3 /100 | #113 | Exceptional 75.9% |
| Immigrants | Zimbabwe | 95.1 /100 | #114 | Exceptional 75.9% |
| Alaska Natives | 95.1 /100 | #115 | Exceptional 75.9% |
| Immigrants | North America | 95.0 /100 | #116 | Exceptional 75.9% |
| Assyrians/Chaldeans/Syriacs | 94.9 /100 | #117 | Exceptional 75.9% |
| Spanish Americans | 94.8 /100 | #118 | Exceptional 75.8% |
| Immigrants | Portugal | 94.8 /100 | #119 | Exceptional 75.8% |
| Immigrants | Africa | 94.6 /100 | #120 | Exceptional 75.8% |
| Immigrants | Serbia | 94.3 /100 | #121 | Exceptional 75.8% |