Immigrants from Netherlands vs Cuban In Labor Force | Age 30-34
COMPARE
Immigrants from Netherlands
Cuban
In Labor Force | Age 30-34
In Labor Force | Age 30-34 Comparison
Immigrants from Netherlands
Cubans
84.6%
IN LABOR FORCE | AGE 30-34
42.1/ 100
METRIC RATING
180th/ 347
METRIC RANK
84.2%
IN LABOR FORCE | AGE 30-34
3.4/ 100
METRIC RATING
224th/ 347
METRIC RANK
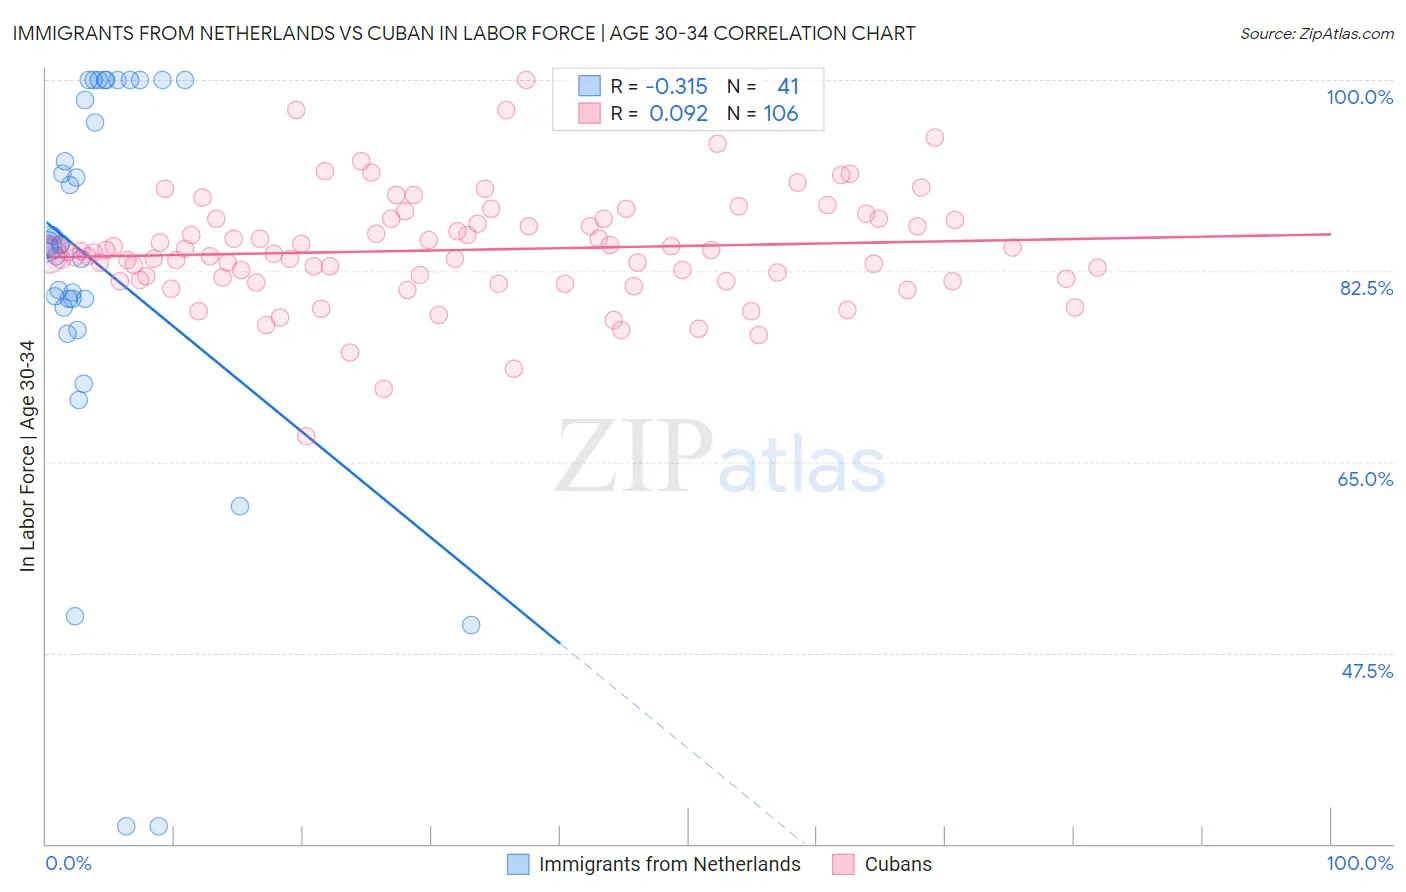
Immigrants from Netherlands vs Cuban In Labor Force | Age 30-34 Correlation Chart
The statistical analysis conducted on geographies consisting of 237,758,588 people shows a mild negative correlation between the proportion of Immigrants from Netherlands and labor force participation rate among population between the ages 30 and 34 in the United States with a correlation coefficient (R) of -0.315 and weighted average of 84.6%. Similarly, the statistical analysis conducted on geographies consisting of 448,964,387 people shows a slight positive correlation between the proportion of Cubans and labor force participation rate among population between the ages 30 and 34 in the United States with a correlation coefficient (R) of 0.092 and weighted average of 84.2%, a difference of 0.54%.
In Labor Force | Age 30-34 Correlation Summary
| Measurement | Immigrants from Netherlands | Cuban |
| Minimum | 31.6% | 67.4% |
| Maximum | 100.0% | 100.0% |
| Range | 68.4% | 32.6% |
| Mean | 83.0% | 84.4% |
| Median | 84.9% | 84.1% |
| Interquartile 25% (IQ1) | 79.5% | 81.6% |
| Interquartile 75% (IQ3) | 99.1% | 87.3% |
| Interquartile Range (IQR) | 19.5% | 5.6% |
| Standard Deviation (Sample) | 17.2% | 5.1% |
| Standard Deviation (Population) | 17.0% | 5.1% |
Similar Demographics by In Labor Force | Age 30-34
Demographics Similar to Immigrants from Netherlands by In Labor Force | Age 30-34
In terms of in labor force | age 30-34, the demographic groups most similar to Immigrants from Netherlands are Immigrants from Nigeria (84.6%, a difference of 0.0%), Okinawan (84.6%, a difference of 0.010%), Moroccan (84.6%, a difference of 0.010%), Laotian (84.7%, a difference of 0.030%), and Barbadian (84.6%, a difference of 0.040%).
| Demographics | Rating | Rank | In Labor Force | Age 30-34 |
| Israelis | 51.1 /100 | #173 | Average 84.7% |
| Finns | 50.0 /100 | #174 | Average 84.7% |
| Immigrants | South America | 50.0 /100 | #175 | Average 84.7% |
| Immigrants | Uzbekistan | 49.1 /100 | #176 | Average 84.7% |
| Laotians | 46.9 /100 | #177 | Average 84.7% |
| Okinawans | 44.1 /100 | #178 | Average 84.6% |
| Immigrants | Nigeria | 42.5 /100 | #179 | Average 84.6% |
| Immigrants | Netherlands | 42.1 /100 | #180 | Average 84.6% |
| Moroccans | 40.3 /100 | #181 | Average 84.6% |
| Barbadians | 36.7 /100 | #182 | Fair 84.6% |
| Immigrants | Canada | 35.0 /100 | #183 | Fair 84.6% |
| Immigrants | North America | 33.3 /100 | #184 | Fair 84.6% |
| Immigrants | Philippines | 31.5 /100 | #185 | Fair 84.6% |
| Immigrants | Congo | 29.7 /100 | #186 | Fair 84.6% |
| Costa Ricans | 29.6 /100 | #187 | Fair 84.6% |
Demographics Similar to Cubans by In Labor Force | Age 30-34
In terms of in labor force | age 30-34, the demographic groups most similar to Cubans are Immigrants from Laos (84.2%, a difference of 0.010%), Salvadoran (84.2%, a difference of 0.020%), Panamanian (84.2%, a difference of 0.020%), Scottish (84.2%, a difference of 0.020%), and Immigrants from El Salvador (84.2%, a difference of 0.020%).
| Demographics | Rating | Rank | In Labor Force | Age 30-34 |
| Immigrants | Trinidad and Tobago | 7.0 /100 | #217 | Tragic 84.3% |
| Immigrants | Panama | 6.3 /100 | #218 | Tragic 84.3% |
| Swiss | 5.8 /100 | #219 | Tragic 84.3% |
| Danes | 5.3 /100 | #220 | Tragic 84.3% |
| Salvadorans | 3.8 /100 | #221 | Tragic 84.2% |
| Panamanians | 3.8 /100 | #222 | Tragic 84.2% |
| Immigrants | Laos | 3.6 /100 | #223 | Tragic 84.2% |
| Cubans | 3.4 /100 | #224 | Tragic 84.2% |
| Scottish | 3.1 /100 | #225 | Tragic 84.2% |
| Immigrants | El Salvador | 3.0 /100 | #226 | Tragic 84.2% |
| Immigrants | Cuba | 3.0 /100 | #227 | Tragic 84.2% |
| Immigrants | Haiti | 2.8 /100 | #228 | Tragic 84.2% |
| Welsh | 2.7 /100 | #229 | Tragic 84.2% |
| Immigrants | Bahamas | 2.6 /100 | #230 | Tragic 84.1% |
| Malaysians | 2.2 /100 | #231 | Tragic 84.1% |