Hispanic or Latino vs Austrian In Labor Force | Age > 16
COMPARE
Hispanic or Latino
Austrian
In Labor Force | Age > 16
In Labor Force | Age > 16 Comparison
Hispanics or Latinos
Austrians
64.3%
IN LABOR FORCE | AGE > 16
1.1/ 100
METRIC RATING
255th/ 347
METRIC RANK
64.6%
IN LABOR FORCE | AGE > 16
4.6/ 100
METRIC RATING
235th/ 347
METRIC RANK
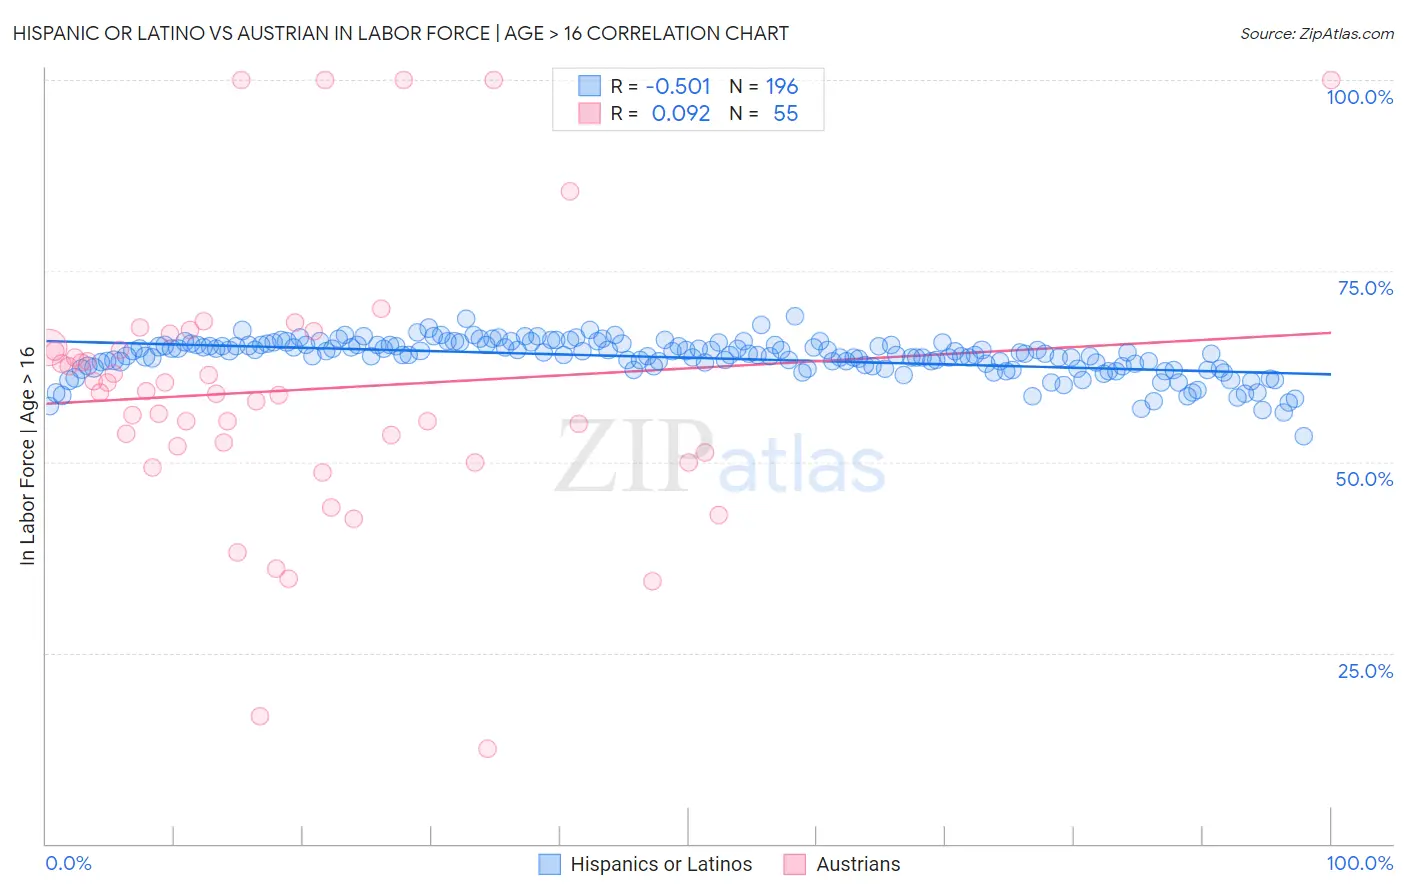
Hispanic or Latino vs Austrian In Labor Force | Age > 16 Correlation Chart
The statistical analysis conducted on geographies consisting of 574,025,710 people shows a substantial negative correlation between the proportion of Hispanics or Latinos and labor force participation rate among population ages 16 and over in the United States with a correlation coefficient (R) of -0.501 and weighted average of 64.3%. Similarly, the statistical analysis conducted on geographies consisting of 452,087,528 people shows a slight positive correlation between the proportion of Austrians and labor force participation rate among population ages 16 and over in the United States with a correlation coefficient (R) of 0.092 and weighted average of 64.6%, a difference of 0.42%.
In Labor Force | Age > 16 Correlation Summary
| Measurement | Hispanic or Latino | Austrian |
| Minimum | 53.4% | 12.5% |
| Maximum | 69.1% | 100.0% |
| Range | 15.7% | 87.5% |
| Mean | 63.7% | 59.4% |
| Median | 64.1% | 59.1% |
| Interquartile 25% (IQ1) | 62.5% | 51.2% |
| Interquartile 75% (IQ3) | 65.3% | 65.0% |
| Interquartile Range (IQR) | 2.8% | 13.8% |
| Standard Deviation (Sample) | 2.5% | 17.9% |
| Standard Deviation (Population) | 2.5% | 17.8% |
Demographics Similar to Hispanics or Latinos and Austrians by In Labor Force | Age > 16
In terms of in labor force | age > 16, the demographic groups most similar to Hispanics or Latinos are Immigrants from Uzbekistan (64.3%, a difference of 0.070%), Immigrants from Dominican Republic (64.4%, a difference of 0.080%), Czechoslovakian (64.3%, a difference of 0.080%), Portuguese (64.4%, a difference of 0.11%), and British West Indian (64.4%, a difference of 0.13%). Similarly, the demographic groups most similar to Austrians are Immigrants from Norway (64.6%, a difference of 0.0%), Italian (64.6%, a difference of 0.0%), Lebanese (64.5%, a difference of 0.050%), Immigrants from Hungary (64.5%, a difference of 0.060%), and Immigrants from Bangladesh (64.5%, a difference of 0.080%).
| Demographics | Rating | Rank | In Labor Force | Age > 16 |
| Austrians | 4.6 /100 | #235 | Tragic 64.6% |
| Immigrants | Norway | 4.6 /100 | #236 | Tragic 64.6% |
| Italians | 4.6 /100 | #237 | Tragic 64.6% |
| Lebanese | 3.9 /100 | #238 | Tragic 64.5% |
| Immigrants | Hungary | 3.8 /100 | #239 | Tragic 64.5% |
| Immigrants | Bangladesh | 3.6 /100 | #240 | Tragic 64.5% |
| Immigrants | Dominica | 3.5 /100 | #241 | Tragic 64.5% |
| Immigrants | Netherlands | 3.4 /100 | #242 | Tragic 64.5% |
| Immigrants | Lebanon | 3.2 /100 | #243 | Tragic 64.5% |
| Tsimshian | 3.1 /100 | #244 | Tragic 64.5% |
| West Indians | 3.0 /100 | #245 | Tragic 64.5% |
| Immigrants | Caribbean | 2.3 /100 | #246 | Tragic 64.4% |
| Swiss | 2.1 /100 | #247 | Tragic 64.4% |
| Immigrants | Barbados | 2.1 /100 | #248 | Tragic 64.4% |
| Germans | 1.8 /100 | #249 | Tragic 64.4% |
| British West Indians | 1.8 /100 | #250 | Tragic 64.4% |
| Portuguese | 1.6 /100 | #251 | Tragic 64.4% |
| Immigrants | Dominican Republic | 1.5 /100 | #252 | Tragic 64.4% |
| Czechoslovakians | 1.4 /100 | #253 | Tragic 64.3% |
| Immigrants | Uzbekistan | 1.4 /100 | #254 | Tragic 64.3% |
| Hispanics or Latinos | 1.1 /100 | #255 | Tragic 64.3% |