Colombian vs Austrian In Labor Force | Age > 16
COMPARE
Colombian
Austrian
In Labor Force | Age > 16
In Labor Force | Age > 16 Comparison
Colombians
Austrians
65.9%
IN LABOR FORCE | AGE > 16
98.4/ 100
METRIC RATING
105th/ 347
METRIC RANK
64.6%
IN LABOR FORCE | AGE > 16
4.6/ 100
METRIC RATING
235th/ 347
METRIC RANK
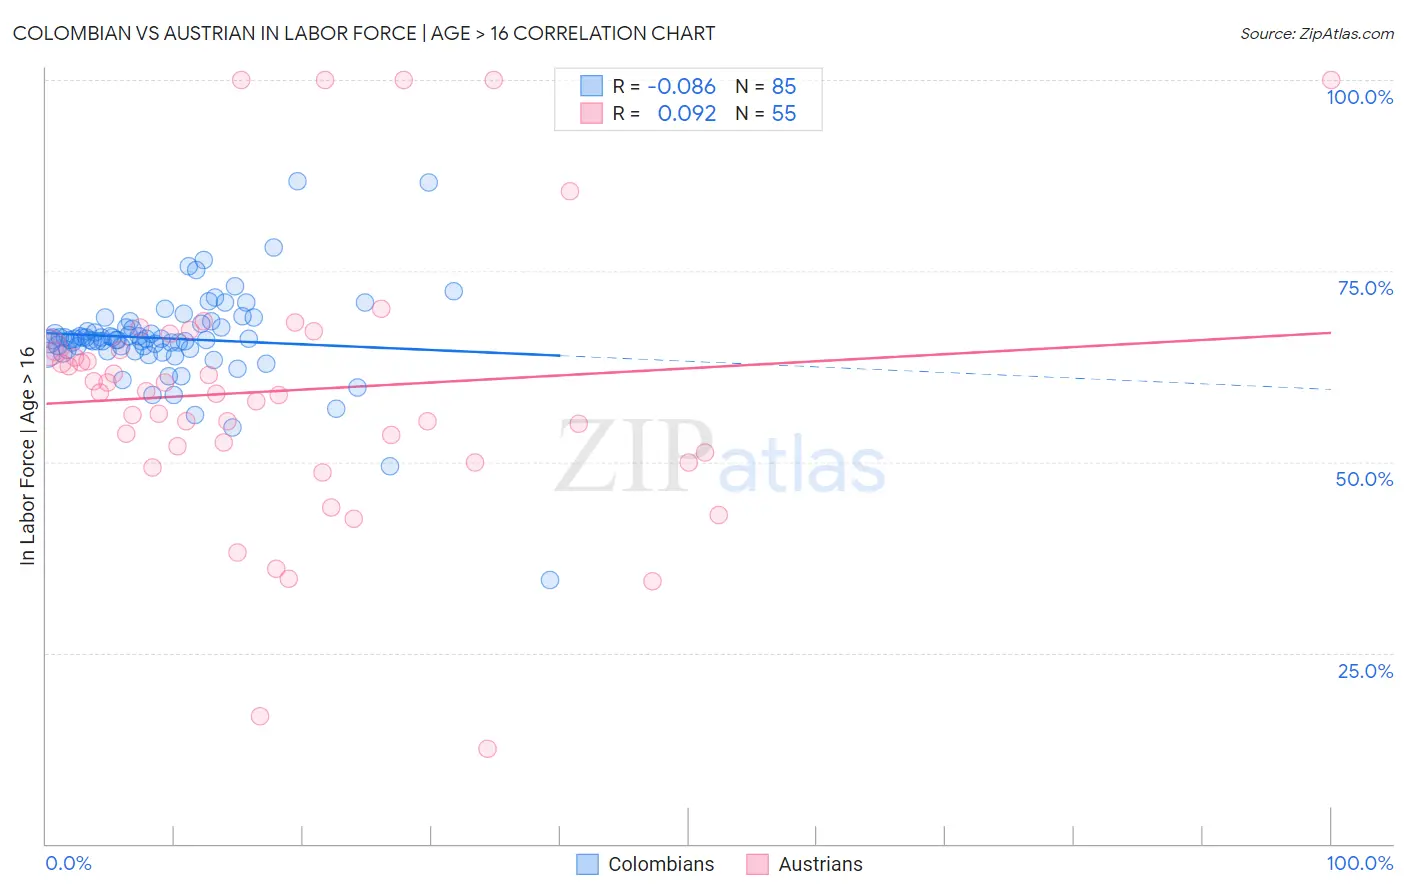
Colombian vs Austrian In Labor Force | Age > 16 Correlation Chart
The statistical analysis conducted on geographies consisting of 419,691,695 people shows a slight negative correlation between the proportion of Colombians and labor force participation rate among population ages 16 and over in the United States with a correlation coefficient (R) of -0.086 and weighted average of 65.9%. Similarly, the statistical analysis conducted on geographies consisting of 452,087,528 people shows a slight positive correlation between the proportion of Austrians and labor force participation rate among population ages 16 and over in the United States with a correlation coefficient (R) of 0.092 and weighted average of 64.6%, a difference of 2.0%.
In Labor Force | Age > 16 Correlation Summary
| Measurement | Colombian | Austrian |
| Minimum | 34.5% | 12.5% |
| Maximum | 86.8% | 100.0% |
| Range | 52.3% | 87.5% |
| Mean | 66.1% | 59.4% |
| Median | 66.0% | 59.1% |
| Interquartile 25% (IQ1) | 64.6% | 51.2% |
| Interquartile 75% (IQ3) | 67.9% | 65.0% |
| Interquartile Range (IQR) | 3.2% | 13.8% |
| Standard Deviation (Sample) | 6.4% | 17.9% |
| Standard Deviation (Population) | 6.4% | 17.8% |
Similar Demographics by In Labor Force | Age > 16
Demographics Similar to Colombians by In Labor Force | Age > 16
In terms of in labor force | age > 16, the demographic groups most similar to Colombians are Palestinian (65.9%, a difference of 0.010%), Immigrants from South Eastern Asia (65.9%, a difference of 0.020%), Immigrants from Colombia (65.9%, a difference of 0.040%), Uruguayan (65.9%, a difference of 0.040%), and Immigrants from Serbia (65.8%, a difference of 0.040%).
| Demographics | Rating | Rank | In Labor Force | Age > 16 |
| Immigrants | Chile | 98.7 /100 | #98 | Exceptional 65.9% |
| Immigrants | Australia | 98.7 /100 | #99 | Exceptional 65.9% |
| Okinawans | 98.7 /100 | #100 | Exceptional 65.9% |
| Immigrants | Colombia | 98.6 /100 | #101 | Exceptional 65.9% |
| Uruguayans | 98.6 /100 | #102 | Exceptional 65.9% |
| Immigrants | South Eastern Asia | 98.5 /100 | #103 | Exceptional 65.9% |
| Palestinians | 98.5 /100 | #104 | Exceptional 65.9% |
| Colombians | 98.4 /100 | #105 | Exceptional 65.9% |
| Immigrants | Serbia | 98.1 /100 | #106 | Exceptional 65.8% |
| Immigrants | Poland | 98.1 /100 | #107 | Exceptional 65.8% |
| Immigrants | Spain | 98.0 /100 | #108 | Exceptional 65.8% |
| Immigrants | Japan | 98.0 /100 | #109 | Exceptional 65.8% |
| Japanese | 97.7 /100 | #110 | Exceptional 65.8% |
| Immigrants | Honduras | 97.5 /100 | #111 | Exceptional 65.8% |
| Laotians | 97.4 /100 | #112 | Exceptional 65.8% |
Demographics Similar to Austrians by In Labor Force | Age > 16
In terms of in labor force | age > 16, the demographic groups most similar to Austrians are Vietnamese (64.6%, a difference of 0.0%), Immigrants from Norway (64.6%, a difference of 0.0%), Italian (64.6%, a difference of 0.0%), Slavic (64.6%, a difference of 0.020%), and Lebanese (64.5%, a difference of 0.050%).
| Demographics | Rating | Rank | In Labor Force | Age > 16 |
| Northern Europeans | 8.2 /100 | #228 | Tragic 64.7% |
| British | 7.3 /100 | #229 | Tragic 64.7% |
| Chinese | 7.3 /100 | #230 | Tragic 64.7% |
| Immigrants | Northern Europe | 7.2 /100 | #231 | Tragic 64.7% |
| Africans | 5.8 /100 | #232 | Tragic 64.6% |
| Slavs | 4.9 /100 | #233 | Tragic 64.6% |
| Vietnamese | 4.7 /100 | #234 | Tragic 64.6% |
| Austrians | 4.6 /100 | #235 | Tragic 64.6% |
| Immigrants | Norway | 4.6 /100 | #236 | Tragic 64.6% |
| Italians | 4.6 /100 | #237 | Tragic 64.6% |
| Lebanese | 3.9 /100 | #238 | Tragic 64.5% |
| Immigrants | Hungary | 3.8 /100 | #239 | Tragic 64.5% |
| Immigrants | Bangladesh | 3.6 /100 | #240 | Tragic 64.5% |
| Immigrants | Dominica | 3.5 /100 | #241 | Tragic 64.5% |
| Immigrants | Netherlands | 3.4 /100 | #242 | Tragic 64.5% |