Guyanese vs Immigrants from Venezuela In Labor Force | Age 20-64
COMPARE
Guyanese
Immigrants from Venezuela
In Labor Force | Age 20-64
In Labor Force | Age 20-64 Comparison
Guyanese
Immigrants from Venezuela
78.1%
IN LABOR FORCE | AGE 20-64
0.0/ 100
METRIC RATING
281st/ 347
METRIC RANK
80.1%
IN LABOR FORCE | AGE 20-64
96.8/ 100
METRIC RATING
89th/ 347
METRIC RANK
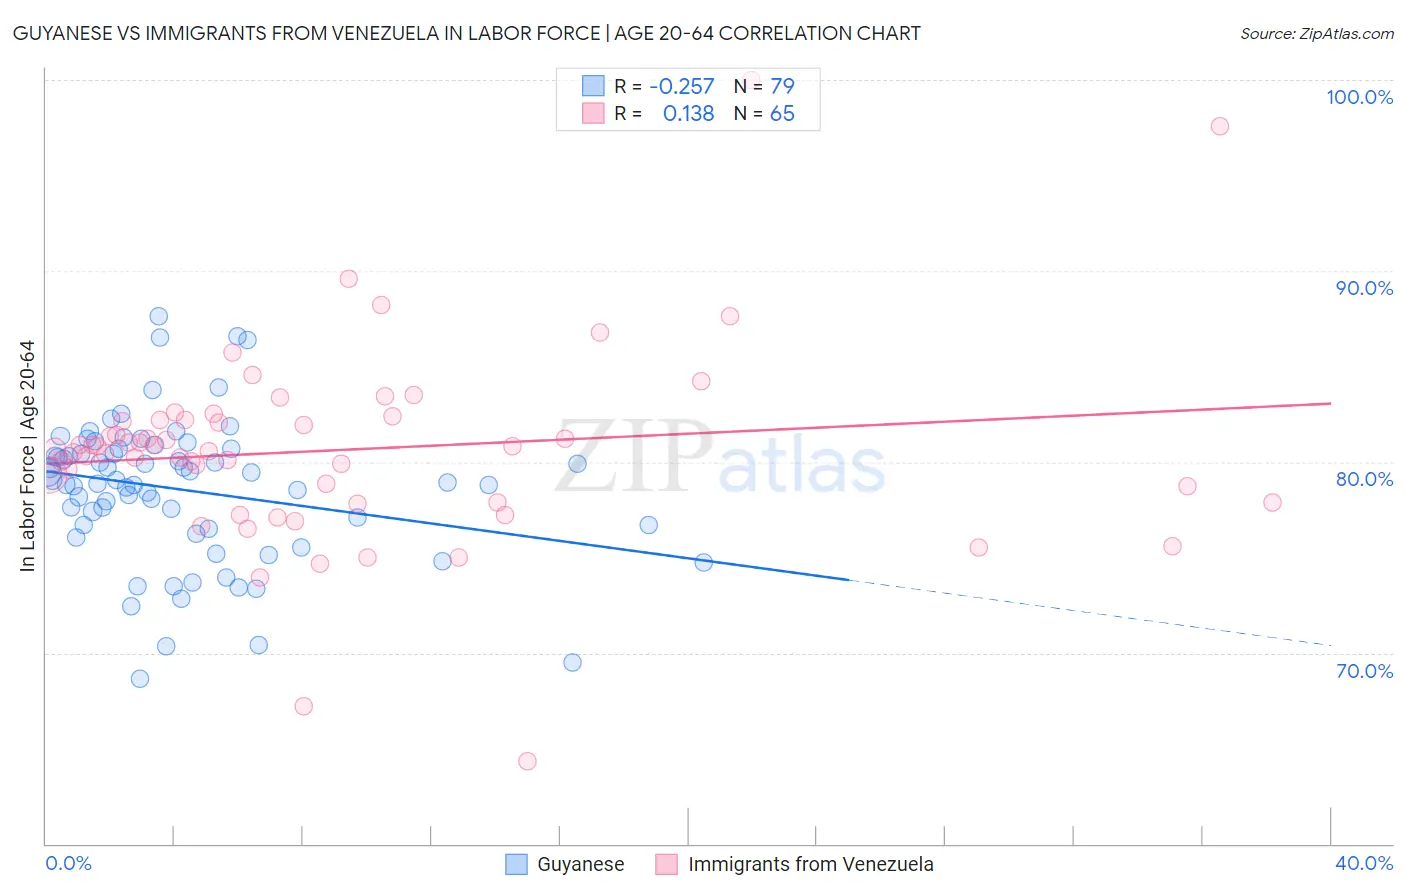
Guyanese vs Immigrants from Venezuela In Labor Force | Age 20-64 Correlation Chart
The statistical analysis conducted on geographies consisting of 176,938,027 people shows a weak negative correlation between the proportion of Guyanese and labor force participation rate among population between the ages 20 and 64 in the United States with a correlation coefficient (R) of -0.257 and weighted average of 78.1%. Similarly, the statistical analysis conducted on geographies consisting of 287,871,392 people shows a poor positive correlation between the proportion of Immigrants from Venezuela and labor force participation rate among population between the ages 20 and 64 in the United States with a correlation coefficient (R) of 0.138 and weighted average of 80.1%, a difference of 2.6%.
In Labor Force | Age 20-64 Correlation Summary
| Measurement | Guyanese | Immigrants from Venezuela |
| Minimum | 68.6% | 64.3% |
| Maximum | 87.6% | 100.0% |
| Range | 19.0% | 35.7% |
| Mean | 78.5% | 80.6% |
| Median | 78.9% | 80.7% |
| Interquartile 25% (IQ1) | 76.5% | 77.9% |
| Interquartile 75% (IQ3) | 80.7% | 82.2% |
| Interquartile Range (IQR) | 4.1% | 4.3% |
| Standard Deviation (Sample) | 3.8% | 5.2% |
| Standard Deviation (Population) | 3.7% | 5.2% |
Similar Demographics by In Labor Force | Age 20-64
Demographics Similar to Guyanese by In Labor Force | Age 20-64
In terms of in labor force | age 20-64, the demographic groups most similar to Guyanese are Immigrants from St. Vincent and the Grenadines (78.1%, a difference of 0.020%), Immigrants from Dominica (78.1%, a difference of 0.030%), Nonimmigrants (78.1%, a difference of 0.030%), Immigrants from Guyana (78.1%, a difference of 0.050%), and Belizean (78.2%, a difference of 0.070%).
| Demographics | Rating | Rank | In Labor Force | Age 20-64 |
| Aleuts | 0.0 /100 | #274 | Tragic 78.2% |
| Spanish | 0.0 /100 | #275 | Tragic 78.2% |
| Puget Sound Salish | 0.0 /100 | #276 | Tragic 78.2% |
| Immigrants | Bahamas | 0.0 /100 | #277 | Tragic 78.2% |
| Mexican American Indians | 0.0 /100 | #278 | Tragic 78.2% |
| Belizeans | 0.0 /100 | #279 | Tragic 78.2% |
| Immigrants | Dominica | 0.0 /100 | #280 | Tragic 78.1% |
| Guyanese | 0.0 /100 | #281 | Tragic 78.1% |
| Immigrants | St. Vincent and the Grenadines | 0.0 /100 | #282 | Tragic 78.1% |
| Immigrants | Nonimmigrants | 0.0 /100 | #283 | Tragic 78.1% |
| Immigrants | Guyana | 0.0 /100 | #284 | Tragic 78.1% |
| Osage | 0.0 /100 | #285 | Tragic 78.0% |
| Immigrants | Belize | 0.0 /100 | #286 | Tragic 78.0% |
| Vietnamese | 0.0 /100 | #287 | Tragic 78.0% |
| Hmong | 0.0 /100 | #288 | Tragic 77.9% |
Demographics Similar to Immigrants from Venezuela by In Labor Force | Age 20-64
In terms of in labor force | age 20-64, the demographic groups most similar to Immigrants from Venezuela are Polish (80.1%, a difference of 0.0%), Chilean (80.1%, a difference of 0.010%), Uruguayan (80.1%, a difference of 0.010%), Ghanaian (80.1%, a difference of 0.010%), and Jordanian (80.1%, a difference of 0.020%).
| Demographics | Rating | Rank | In Labor Force | Age 20-64 |
| Immigrants | Japan | 97.3 /100 | #82 | Exceptional 80.1% |
| Colombians | 97.3 /100 | #83 | Exceptional 80.1% |
| Immigrants | Latvia | 97.2 /100 | #84 | Exceptional 80.1% |
| Jordanians | 97.2 /100 | #85 | Exceptional 80.1% |
| Immigrants | Egypt | 97.1 /100 | #86 | Exceptional 80.1% |
| Croatians | 97.1 /100 | #87 | Exceptional 80.1% |
| Chileans | 97.0 /100 | #88 | Exceptional 80.1% |
| Immigrants | Venezuela | 96.8 /100 | #89 | Exceptional 80.1% |
| Poles | 96.8 /100 | #90 | Exceptional 80.1% |
| Uruguayans | 96.7 /100 | #91 | Exceptional 80.1% |
| Ghanaians | 96.7 /100 | #92 | Exceptional 80.1% |
| Immigrants | Belarus | 96.4 /100 | #93 | Exceptional 80.1% |
| Immigrants | Asia | 96.0 /100 | #94 | Exceptional 80.1% |
| Yugoslavians | 95.9 /100 | #95 | Exceptional 80.1% |
| Immigrants | Malaysia | 95.9 /100 | #96 | Exceptional 80.1% |