Greek vs Immigrants from Portugal In Labor Force | Age 16-19
COMPARE
Greek
Immigrants from Portugal
In Labor Force | Age 16-19
In Labor Force | Age 16-19 Comparison
Greeks
Immigrants from Portugal
38.9%
IN LABOR FORCE | AGE 16-19
99.3/ 100
METRIC RATING
97th/ 347
METRIC RANK
39.7%
IN LABOR FORCE | AGE 16-19
99.9/ 100
METRIC RATING
77th/ 347
METRIC RANK
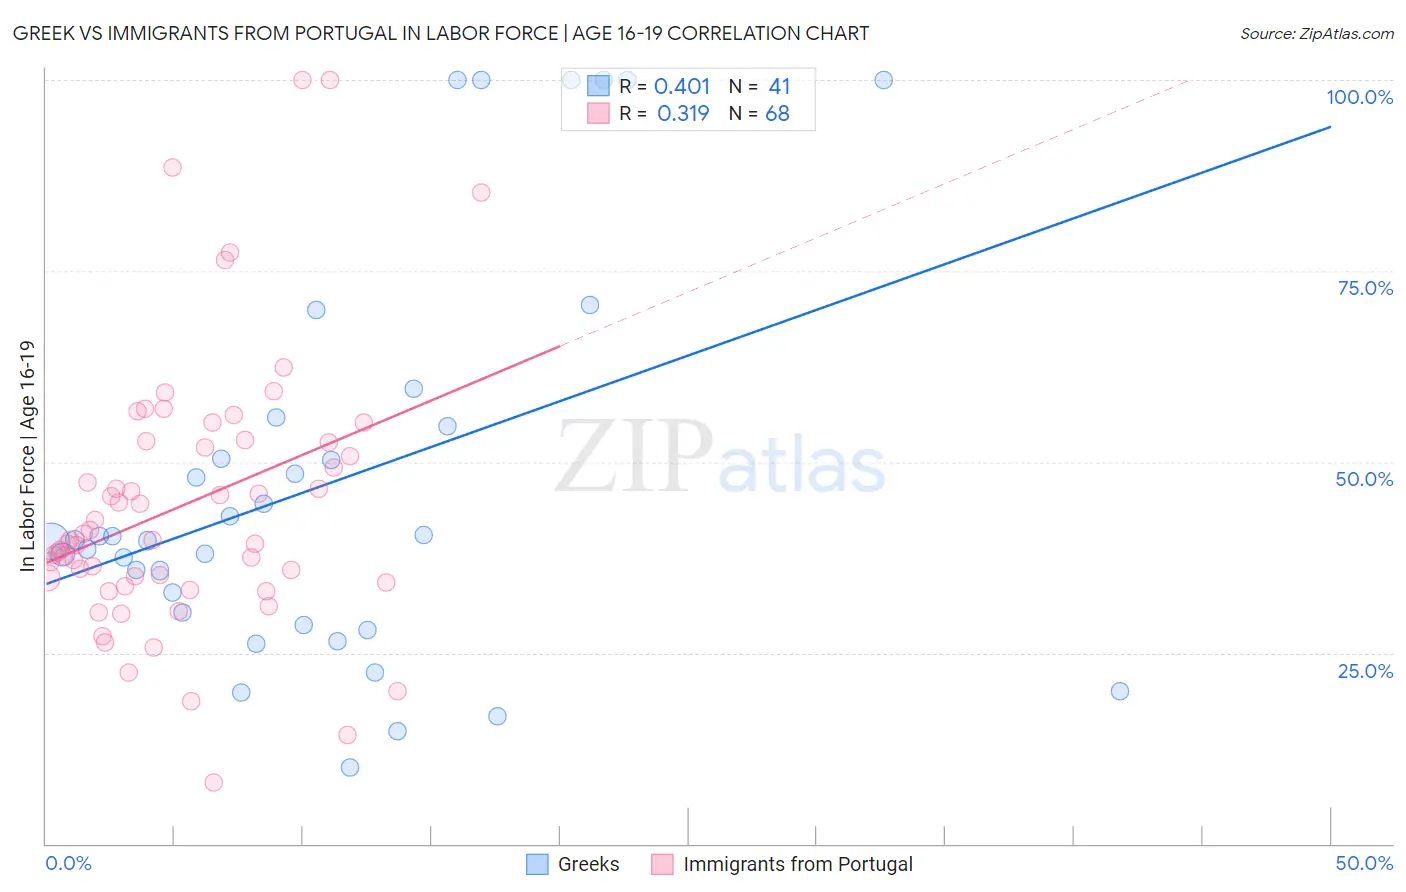
Greek vs Immigrants from Portugal In Labor Force | Age 16-19 Correlation Chart
The statistical analysis conducted on geographies consisting of 481,502,994 people shows a moderate positive correlation between the proportion of Greeks and labor force participation rate among population between the ages 16 and 19 in the United States with a correlation coefficient (R) of 0.401 and weighted average of 38.9%. Similarly, the statistical analysis conducted on geographies consisting of 174,562,650 people shows a mild positive correlation between the proportion of Immigrants from Portugal and labor force participation rate among population between the ages 16 and 19 in the United States with a correlation coefficient (R) of 0.319 and weighted average of 39.7%, a difference of 2.1%.
In Labor Force | Age 16-19 Correlation Summary
| Measurement | Greek | Immigrants from Portugal |
| Minimum | 10.0% | 8.0% |
| Maximum | 100.0% | 100.0% |
| Range | 90.0% | 92.0% |
| Mean | 47.2% | 44.4% |
| Median | 39.8% | 39.8% |
| Interquartile 25% (IQ1) | 29.5% | 34.5% |
| Interquartile 75% (IQ3) | 55.3% | 52.6% |
| Interquartile Range (IQR) | 25.8% | 18.1% |
| Standard Deviation (Sample) | 25.8% | 17.8% |
| Standard Deviation (Population) | 25.5% | 17.6% |
Demographics Similar to Greeks and Immigrants from Portugal by In Labor Force | Age 16-19
In terms of in labor force | age 16-19, the demographic groups most similar to Greeks are Latvian (38.9%, a difference of 0.040%), Immigrants from North America (38.9%, a difference of 0.070%), Blackfeet (38.9%, a difference of 0.16%), Immigrants from Canada (38.9%, a difference of 0.16%), and Osage (39.0%, a difference of 0.22%). Similarly, the demographic groups most similar to Immigrants from Portugal are Austrian (39.5%, a difference of 0.39%), Marshallese (39.5%, a difference of 0.52%), Immigrants from Iraq (39.4%, a difference of 0.70%), Shoshone (39.3%, a difference of 0.98%), and Basque (39.3%, a difference of 1.0%).
| Demographics | Rating | Rank | In Labor Force | Age 16-19 |
| Immigrants | Portugal | 99.9 /100 | #77 | Exceptional 39.7% |
| Austrians | 99.8 /100 | #78 | Exceptional 39.5% |
| Marshallese | 99.8 /100 | #79 | Exceptional 39.5% |
| Immigrants | Iraq | 99.8 /100 | #80 | Exceptional 39.4% |
| Shoshone | 99.7 /100 | #81 | Exceptional 39.3% |
| Basques | 99.7 /100 | #82 | Exceptional 39.3% |
| Spanish | 99.7 /100 | #83 | Exceptional 39.3% |
| Immigrants | Uganda | 99.7 /100 | #84 | Exceptional 39.2% |
| Creek | 99.6 /100 | #85 | Exceptional 39.1% |
| Samoans | 99.6 /100 | #86 | Exceptional 39.1% |
| Immigrants | Germany | 99.6 /100 | #87 | Exceptional 39.1% |
| Puget Sound Salish | 99.6 /100 | #88 | Exceptional 39.1% |
| Alaska Natives | 99.6 /100 | #89 | Exceptional 39.1% |
| Immigrants | Burma/Myanmar | 99.5 /100 | #90 | Exceptional 39.0% |
| Spanish Americans | 99.5 /100 | #91 | Exceptional 39.0% |
| Osage | 99.4 /100 | #92 | Exceptional 39.0% |
| Blackfeet | 99.4 /100 | #93 | Exceptional 38.9% |
| Immigrants | Canada | 99.4 /100 | #94 | Exceptional 38.9% |
| Immigrants | North America | 99.4 /100 | #95 | Exceptional 38.9% |
| Latvians | 99.4 /100 | #96 | Exceptional 38.9% |
| Greeks | 99.3 /100 | #97 | Exceptional 38.9% |