Iraqi vs Immigrants from Eastern Asia In Labor Force | Age 25-29
COMPARE
Iraqi
Immigrants from Eastern Asia
In Labor Force | Age 25-29
In Labor Force | Age 25-29 Comparison
Iraqis
Immigrants from Eastern Asia
83.9%
IN LABOR FORCE | AGE 25-29
0.9/ 100
METRIC RATING
235th/ 347
METRIC RANK
84.8%
IN LABOR FORCE | AGE 25-29
72.6/ 100
METRIC RATING
139th/ 347
METRIC RANK
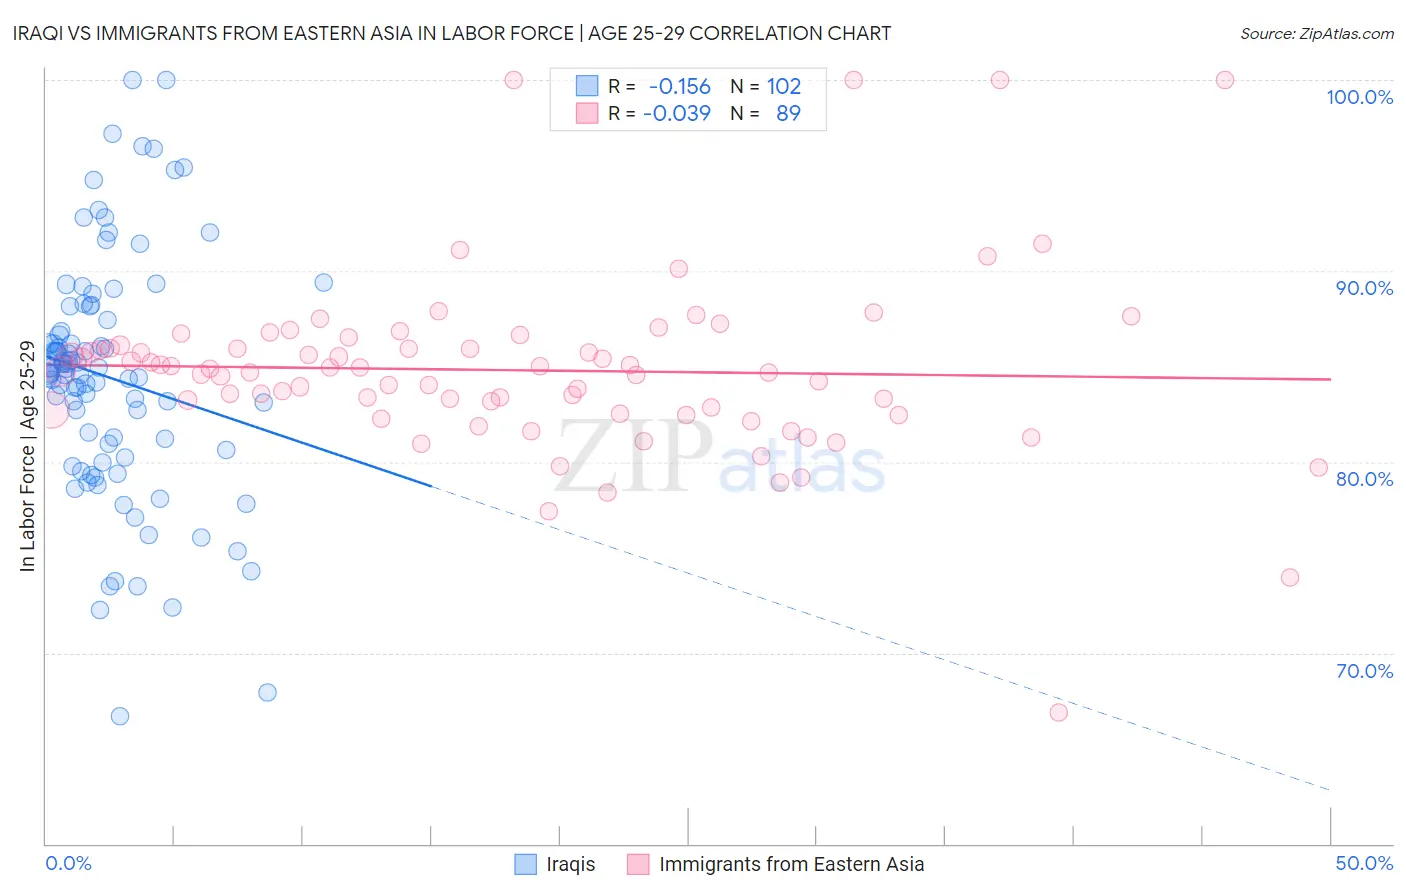
Iraqi vs Immigrants from Eastern Asia In Labor Force | Age 25-29 Correlation Chart
The statistical analysis conducted on geographies consisting of 170,636,038 people shows a poor negative correlation between the proportion of Iraqis and labor force participation rate among population between the ages 25 and 29 in the United States with a correlation coefficient (R) of -0.156 and weighted average of 83.9%. Similarly, the statistical analysis conducted on geographies consisting of 499,536,378 people shows no correlation between the proportion of Immigrants from Eastern Asia and labor force participation rate among population between the ages 25 and 29 in the United States with a correlation coefficient (R) of -0.039 and weighted average of 84.8%, a difference of 1.1%.
In Labor Force | Age 25-29 Correlation Summary
| Measurement | Iraqi | Immigrants from Eastern Asia |
| Minimum | 66.7% | 66.9% |
| Maximum | 100.0% | 100.0% |
| Range | 33.3% | 33.1% |
| Mean | 84.4% | 84.8% |
| Median | 84.8% | 84.7% |
| Interquartile 25% (IQ1) | 80.6% | 82.6% |
| Interquartile 75% (IQ3) | 87.5% | 86.0% |
| Interquartile Range (IQR) | 6.9% | 3.4% |
| Standard Deviation (Sample) | 6.3% | 4.8% |
| Standard Deviation (Population) | 6.3% | 4.7% |
Similar Demographics by In Labor Force | Age 25-29
Demographics Similar to Iraqis by In Labor Force | Age 25-29
In terms of in labor force | age 25-29, the demographic groups most similar to Iraqis are Guamanian/Chamorro (83.9%, a difference of 0.0%), Immigrants (83.9%, a difference of 0.010%), Barbadian (83.9%, a difference of 0.020%), Immigrants from Uzbekistan (83.9%, a difference of 0.030%), and Jamaican (83.9%, a difference of 0.040%).
| Demographics | Rating | Rank | In Labor Force | Age 25-29 |
| Immigrants | Panama | 5.5 /100 | #228 | Tragic 84.2% |
| Immigrants | Oceania | 5.0 /100 | #229 | Tragic 84.2% |
| Whites/Caucasians | 4.8 /100 | #230 | Tragic 84.2% |
| Immigrants | Philippines | 4.7 /100 | #231 | Tragic 84.2% |
| Panamanians | 4.5 /100 | #232 | Tragic 84.2% |
| Immigrants | Western Asia | 2.7 /100 | #233 | Tragic 84.1% |
| Barbadians | 1.0 /100 | #234 | Tragic 83.9% |
| Iraqis | 0.9 /100 | #235 | Tragic 83.9% |
| Guamanians/Chamorros | 0.9 /100 | #236 | Tragic 83.9% |
| Immigrants | Immigrants | 0.9 /100 | #237 | Tragic 83.9% |
| Immigrants | Uzbekistan | 0.8 /100 | #238 | Tragic 83.9% |
| Jamaicans | 0.8 /100 | #239 | Tragic 83.9% |
| Trinidadians and Tobagonians | 0.7 /100 | #240 | Tragic 83.9% |
| Alsatians | 0.7 /100 | #241 | Tragic 83.9% |
| U.S. Virgin Islanders | 0.6 /100 | #242 | Tragic 83.8% |
Demographics Similar to Immigrants from Eastern Asia by In Labor Force | Age 25-29
In terms of in labor force | age 25-29, the demographic groups most similar to Immigrants from Eastern Asia are Armenian (84.8%, a difference of 0.0%), Immigrants from North America (84.8%, a difference of 0.0%), Immigrants from Canada (84.8%, a difference of 0.010%), Danish (84.8%, a difference of 0.010%), and Pakistani (84.8%, a difference of 0.020%).
| Demographics | Rating | Rank | In Labor Force | Age 25-29 |
| Romanians | 77.7 /100 | #132 | Good 84.8% |
| Asians | 77.7 /100 | #133 | Good 84.8% |
| Syrians | 76.5 /100 | #134 | Good 84.8% |
| Immigrants | Hungary | 76.4 /100 | #135 | Good 84.8% |
| Bhutanese | 76.0 /100 | #136 | Good 84.8% |
| Immigrants | Canada | 73.5 /100 | #137 | Good 84.8% |
| Armenians | 72.7 /100 | #138 | Good 84.8% |
| Immigrants | Eastern Asia | 72.6 /100 | #139 | Good 84.8% |
| Immigrants | North America | 72.1 /100 | #140 | Good 84.8% |
| Danes | 71.9 /100 | #141 | Good 84.8% |
| Pakistanis | 70.0 /100 | #142 | Good 84.8% |
| Sri Lankans | 69.2 /100 | #143 | Good 84.8% |
| Immigrants | Laos | 69.0 /100 | #144 | Good 84.8% |
| Immigrants | Senegal | 68.3 /100 | #145 | Good 84.8% |
| Icelanders | 68.2 /100 | #146 | Good 84.8% |